Box And Whisker Plots - Statistical Survey Project
- Zip
What educators are saying
Description
Box-And-Whisker Plots - Statistical Survey Project
This Statistical Survey Project offers students the opportunity to demonstrate an understanding of Statistics content through the lens of a personalized statistical survey and the creation/study of a Box-And-Whisker Plot.
Students insert themselves into their learning by selecting their own personalized survey question. Students have fun creating their posters, sharing them with the class, and having them displayed for all to see in the classroom. This project is a great, fun way to conclude a statistics unit.
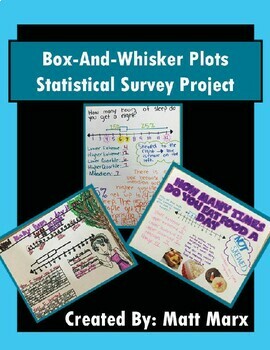
Students work involves the administering of a personally chosen survey question, the studying of the results, the creation of a poster displaying said study of the results, as well as a presentation of said poster as a demonstration of learning. Students' posters offer great opportunity for creating a beautiful display in your classroom.
Depending on which state you teach in, this project fulfills many Common Core and/or State Standards involving Data Analysis in Grade 7 Math, Grade 8 Math, Algebra I, and/or High School Statistics. More generally, this project aligns with standards involving the use of data displays (such as Box-And-Whisker Plots) to problem solve and/or make predictions.
I have included several examples of student-made posters to aid you and your students in your engagement with this project.


