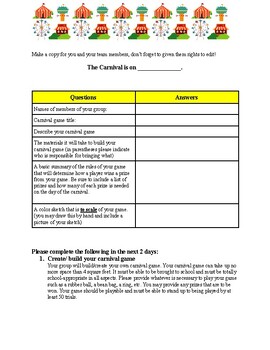
Carnival Game Proposal for 7th Math Probability Project
Mrs Glitterski Classroom
7 Followers
Grade Levels
7th
Subjects
Standards
CCSS7.SP.B.4
CCSS7.SP.C.6
CCSS7.SP.C.7
CCSS7.SP.C.7b
Formats Included
- PDF
Pages
4 pages
Mrs Glitterski Classroom
7 Followers
Description
This project has students create a carnival game and then the class plays them to compare theoretical and experimental probability.
Total Pages
4 pages
Answer Key
Rubric only
Teaching Duration
4 days
Report this resource to TPT
Reported resources will be reviewed by our team. Report this resource to let us know if this resource violates TPT’s content guidelines.
Standards
to see state-specific standards (only available in the US).
CCSS7.SP.B.4
Use measures of center and measures of variability for numerical data from random samples to draw informal comparative inferences about two populations. For example, decide whether the words in a chapter of a seventh-grade science book are generally longer than the words in a chapter of a fourth-grade science book.
CCSS7.SP.C.6
Approximate the probability of a chance event by collecting data on the chance process that produces it and observing its long-run relative frequency, and predict the approximate relative frequency given the probability. For example, when rolling a number cube 600 times, predict that a 3 or 6 would be rolled roughly 200 times, but probably not exactly 200 times.
CCSS7.SP.C.7
Develop a probability model and use it to find probabilities of events. Compare probabilities from a model to observed frequencies; if the agreement is not good, explain possible sources of the discrepancy.
CCSS7.SP.C.7b
Develop a probability model (which may not be uniform) by observing frequencies in data generated from a chance process. For example, find the approximate probability that a spinning penny will land heads up or that a tossed paper cup will land open-end down. Do the outcomes for the spinning penny appear to be equally likely based on the observed frequencies?


