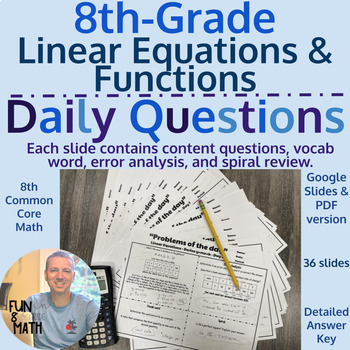
Linear Equations & Functions 8th Grade Unit - Daily Question
- Zip
- Google Apps™

What educators are saying
Also included in
- This 8th-grade math bundle for the Linear Equations & Functions unit will help ensure that you and your students achieve success! Students will practice graphing linear and non-linear equations, finding the slope from two coordinates, and writing an equation in y=mx+b from two points. Students wPrice $24.50Original Price $35.00Save $10.50
- This resource provides teachers with 175 slides for working with all of the topics in 8th-grade math. It contains 7 unit resources, at a discounted price of 20% off the listed prices! Students will practice with skill-based problems, real-world application questions, and error analysis to support hiPrice $26.80Original Price $33.50Save $6.70
- This mega bundle provides teachers with 71 resources for working with all of the topics in 8th-grade math. It contains 7 unit resources, at a discounted price of 30% off the listed prices! Resources will cover all of the topics; the number system, scientific notation, exponents, roots, multi-step eqPrice $159.50Original Price $246.50Save $87.00
Description
This 8th-grade math resource provides teachers with 36 slides for working with linear equations and functions unit. Students will practice graphing linear and non-linear equations, finding the slope from two coordinates, and writing an equation in y=mx+b from two points. Students will also identify functions, analyze functions, write equations for functions from tables, graphs, and ordered pairs, and describe functional relationships by analyzing a graph. Students will practice with skill-based problems, real-world application questions, and error analysis to support higher-level thinking skills.
Each slide contains:
⭐A content question or questions
⭐Error analysis question
⭐Vocab word
⭐Spiral review question
Included in this product:
*PDF version ready to print
*Google Slides version that is completely editable
*Detailed answer key
Hit the "View Preview" button to see some of the slides!
✨Connect with Me!
- Join my Facebook group
- Follow me on Instagram
- Email me your questions or comments
- Join my Email List
Save with this ⭐Unit Bundle⭐
Linear Equations & Functions Unit BUNDLE
You may also like these other ⭐"Problems of the Day"⭐ resources!
BUNDLE - All 7 resources (20% off)
8th Grade - Numbers & Operations Unit
8th Grade - Multi-Step Equations Unit
8th Grade - Linear Equations & Functions
8th Grade - Systems of Equations
8th Grade - Scatter Plots & Two-way tables
Customer Tips
How to get TPT credit to use on future purchases
• Please go to your My Purchases page (you may need to
login). Beside each purchase, you'll see a Provide Feedback button.
Simply click it and you will be taken to a page where you can give a quick rating and
leave a short comment for the product. Each time you give feedback, TPT gives you
feedback credits that you use to lower the cost of your future purchases. I value your
feedback greatly!
LICENSING TERMS: This purchase includes a license for one teacher only for personal use in their classroom. Licenses are non-transferable, meaning they can not be passed from one teacher to another. No part of this resource is to be shared with colleagues or used by an entire grade level, school, or district without purchasing the proper number of licenses.
COPYRIGHT TERMS: This resource may not be uploaded to the internet in any form, including classroom/personal websites or network drives, unless the site is password protected and can only be accessed by students.


