
Pointsheet


- Zip
- Excel Spreadsheets
Also included in
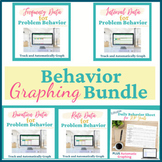 Introducing the comprehensive Behavior Measurement Graphing Bundle - your ultimate solution for effectively collecting and tracking classroom behavior data with ease. This all-in-one package empowers teachers like you to measure and graph various behavior aspects, including frequency, rate, durationPrice $24.00Original Price $30.00Save $6.00
 FBA, BIP, Progress Monitoring (Mega Bundle) includes everything for the FBA BIP Bundle, PLUS progress monitoring/graphing resources!What's IncludedFBA Interview FormsFBA Parent Interview FormFBA Teacher Interview FormFBA Student Interview FormFBA Behavior Observation FormsAnecdotal Observation NotesPrice $59.00Original Price $73.75Save $14.75
Description
Use this Pointsheet to track & automatically graph IEP behavior goals.
Your purchase of Pointsheet includes:
- Daily and Weekly Behavior Percentage Graphs through the 2025-2026 school year
- Point sheet with five operationally-defined behaviors
- Editable point sheet to match your student's specific IEP behavior goals
PLUS
- Common Data Collection Methods Quick Overview
- Quick Excel Tips
Included EDITABLE point sheet helps take the guesswork & emotionality out of grading student behavior in classroom (for you, your paras, or partner teachers) by basing it on the number of prompts a student receives in each defined time frame.
Easily enter your data into the Excel percent graph-maker to automatically create professional-looking graphs (daily or weekly) for intervention-tracking, IEP meetings, or progress reports.
Note
The Pointsheet graph would work in Excel or Google Sheets, but you must use Excel if you want to enter phase lines, as Google Sheets does not have this feature.
You May Also Be Interested In...
Duration Data for Problem Behavior (Duration ABA)
- 4 different Duration Recording Forms
- Weekly Behavior Duration Graphs through the 2025-2026 school year
Frequency Data for Problem Behavior (Frequency Tables Excel)
- 2 different Frequency Recording Forms
- Daily and Weekly Behavior Frequency Graphs through the 2025-2026 school year
Interval Data for Problem Behavior (Interval in Excel)
- 6 different Interval Recording Forms
- Daily Behavior Interval Graphs through the 2025-2026 school year
Rate Data for Problem Behavior (Rate on Excel)
- 3 different Behavior Rate Recording Forms
- 1 Rate of Positive Interactions to Corrections Form (helpful for self-reflection)
- Weekly Behavior Rate Graphs through the 2025-2026 school year
Please follow me on TPT for more great behavior tracking and SEL resources. And remember, if you purchase, please leave a review and TPT will give you credits toward more fabulous TPT resources!
