38 results
4th grade statistics resources for Easel Activities
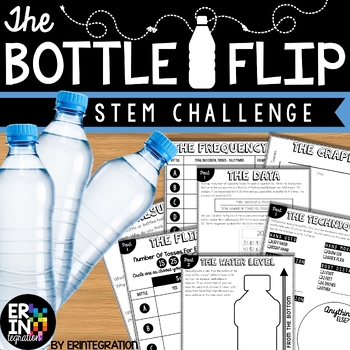
Water Bottle Flip STEM Challenge + STEM Activity
The ORIGINAL water bottle flip STEM activity and lab! Water bottle flip at school? Absolutely! Students will love this on-trend STEM challenge inspired by the popular YouTube water bottle flipping challenge where students toss a water bottle and attempt to land it straight up. Practice scientific method with some probability, fractions and data collection in the mix while having fun!This self-paced, low-prep, project based learning water bottle flip STEM challenge is print-and-go. Each activit
Subjects:
Grades:
3rd - 6th
Types:
CCSS:
NGSS:
K-2-ETS1-2
, K-2-ETS1-3
, MS-ETS1-2
, K-2-ETS1-1
, 3-5-ETS1-3
...
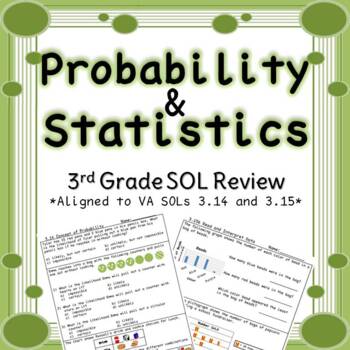
Third Grade Probability and Graphing Review
Now aligns to the new 2016 VA SOLs. This product is a 5 page practice packet/mixed review that aligns to 3rd grade VA Math SOLs. It covers all the SOLs in the 3rd grade Probability/Statistics Strand, including the following math topics:-Collecting Data-Organizing Data-Representing Data-Interpreting Data-Bar Graphs-Picture Graphs-Probability-CombinationsAn answer key is included for each page. This product can be used as whole group practice, small group practice, independent practice, remediatio
Subjects:
Grades:
2nd - 4th
Types:
Also included in: Third Grade Math SOL Review Bundle
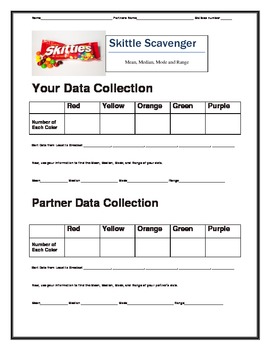
Skittles Candy with Mean, Median, Mode, Range, and Box and Whiskers Plot
This is a quick, fun activity to use with statistics. I have the kids bring in a pack of skittles and sort by color. Then all of the kids will find the Mean, Median, Mode, Range, and Box and Whiskers.
Subjects:
Grades:
4th - 8th
Types:
Sweets Probability Activities (chocolate, candy, M&Ms, Skittles, Kisses)
Uses chocolates or candy (M&Ms, Skittles, Kisses) to practice probability!
What's included-
*Colored candy probability activity: have students randomly pick colored candy and tally what's picked to experiment probability
*Colored candy probability activity reflection page- have students reflect on the experiment and explain their thinking
*M&M's probability activity: have students figure out how many M&M's are in a bag and what color of each by using probability
*M&M's probabil
Subjects:
Grades:
2nd - 8th
Types:
Also included in: Probability Activity BUNDLE
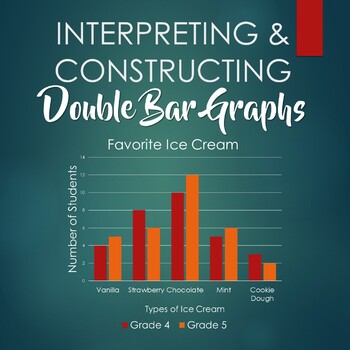
Interpreting and Constructing Double Bar Graphs - Booklet
This booklet includes six worksheets:- 3 double bar graphs for students to interpret- 3 sets of data for students to construct double bar graphs, with corresponding questions- answer key
Subjects:
Grades:
3rd - 6th
Types:
Mean Dice Math: mean, median, mode, and range
"Mean Dice" uses dice to practice calculating mean, median, mode, and range. Comes with two versions, each with a whole group introductory activity, an independent practice worksheet, and instructions for both levels of the "Mean Dice" game. Note: versions of this activity appear in EZSubPlans 4.1 and 6.1.
Subjects:
Grades:
4th - 7th
Types:
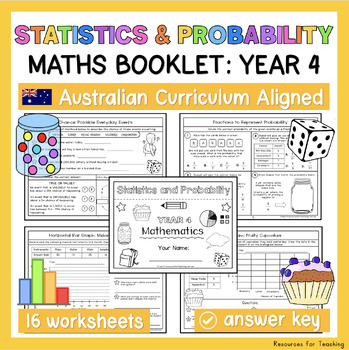
YEAR 4 Statistics and Probability Worksheets and Booklet - Australian Curriculum
This printable booklet includes 16 engaging worksheets to support Year 4 students learning about Statistics and Probability in the Mathematics syllabus. Plenty of outcomes are covered within this resource to save you time prepping activities for your students! The main topics covered within this resource and strand of learning include: chance and data representation & interpretation✩ ALL Year 4 Australian Curriculum Maths Outcomes are linked to this 'Statistics and Probability' booklet.✩ Inc
Subjects:
Grades:
4th
Types:
Also included in: YEAR 4 Maths Booklet Bundle - Australian Curriculum Outcomes
Data and Graphs Projects, 5th and 6th Grade Math Enrichment
Fun Data and Graph Enrichment Projects Students Love! Nine fun math projects that range from finding distances from cities to Olympic records and even charting calories on a super sized cheeseburger. The fun and creative projects utilize line plots, line graphs, bar graphs, double bar graphs, pie/circle graphs, mode, median, mean and range. I've also included a set of vocabulary terms, sample graphs and and a rubric! Print and go math enrichment! Perfect for distance learning as well.Please che
Subjects:
Grades:
4th - 6th
Types:
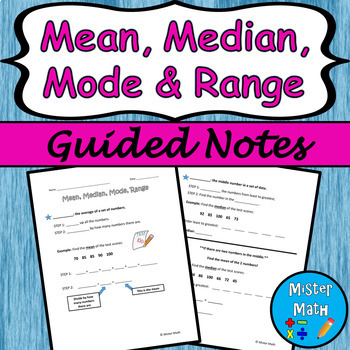
Mean, Median, Mode & Range Guided Notes
This is a guided notes resource to assist students in learning about finding the mean, median, mode, and range of data sets. The guided notes include definitions, as well as a guided example for each skill. An independent practice worksheet is included that asks students to find the mean, median, mode and range for four data sets (for a total of 16 extra practice problems!) An answer key is also provided.This Guided Notes packet is also part of a BUNDLE that includes a PowerPoint presentation to
Subjects:
Grades:
3rd - 6th
Also included in: Mean, Median, Mode & Range PPT and Guided Notes BUNDLE
Finding Mean, Median, Mode, and Range
Simple worksheets (5 problems each) to introduce and practice finding the mean, median, mode, and range of a data set. Have students complete with or without calculator, depending on their instructional level. Product includes:-Reference posters for mean, median, mode, and range. Each poster includes the measures' definitions and directions for how to find them with an example.-5 worksheets about finding the mean.-5 worksheets about finding the median.-5 worksheets about finding the mode.-5 work
Subjects:
Grades:
1st - 12th
Types:
4th Grade Data & Line Plots, 30 Enrichment Projects and 30 Test-Prep Problems
No-prep, 4th Grade data and line plots practice with 30 enrichment projects and 30 review test-prep questions aligned to the standards. Great for teaching the important data standards in a fun, engaging way. Excellent for early finishers, advanced math students or whole class practice. Print and go math enrichment! These work perfectly for distance learning as well.This resource includes thirty 4th Grade Common Core data and line plots problem solving test-prep questions and 30 no-prep data and
Subjects:
Grades:
4th
CCSS:
Also included in: 4th Grade Math Projects For Every Standard! Enrichment All-Year Bundle!
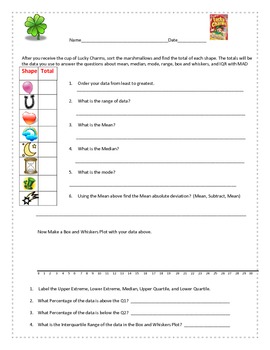
Lucky Charms -Statistics, Mean, Median, Mode, Box and Whiskers Plot
Lucky Charms -Statistics, Mean, Median, Mode, Box and Whiskers Plot.
This is a fun activity to do with your kids to review statistics. The students will enjoy sorting the marshmallows and counting the data to be used for statistics. The first part is individual data but the second part is combining the class data. Make sure your data range will fit on the box plot.
Subjects:
Grades:
4th - 8th
Types:
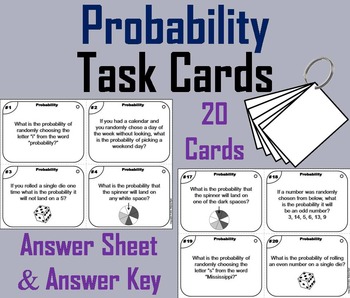
Simple Probability Task Cards Activity 4th 5th 6th Grade
Probability: These task cards are a great way for students to have fun while they practice their skills with calculating probability. There are 20 questions and include an answer sheet as well as an answer key.
Important: If you enjoyed this product, check out my other Math Task Cards:
Grades 1-3: Get all 18 (35% OFF) in the Bundle!
♦ Addition
♦ Addition and Subtraction: 2 Digit
♦ Addition: 3 Digit
♦ Arrays
♦ Balancing Equations
Subjects:
Grades:
4th - 6th
Types:
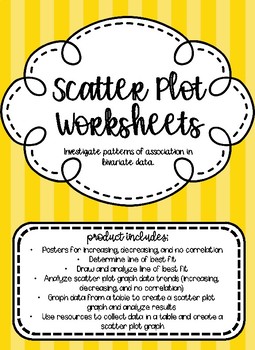
Scatter Plot Graph Worksheets
A collection of worksheets to use when teaching how to investigate patterns of association in bivariate data. Product includes 3 posters for students to reference how to determine if data is increasing, decreasing, or has no correlation. Types of worksheets include:
-Determine line of best fit
-Draw and analyze line of best fit
-Analyze scatter plot graph data trends (increasing, decreasing, and no correlation)
-Graph data from a table to create a scatter plot graph and analyze results
-Use reso
Subjects:
Grades:
1st - 12th
Types:
Interpreting Graphs for the Middle & Junior High School: Book 2
Here is another set of data graphics for your students to analyze and interpret. Using survey results from the USA Today newspaper, students will be asked to explain what the graphics are illustrating. Each activity will ask the student to identify basic information presented in each graphic and make some projections based on the data given in the survey.
The activities in this packet are a great way to improve your student’s skills in taking apart graphic displays of information. Brin
Subjects:
Grades:
4th - 10th, Adult Education
Types:
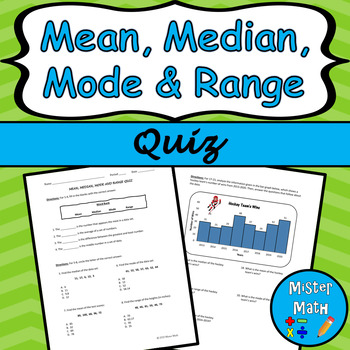
Mean, Median, Mode & Range Quiz
Assess your students' knowledge and skills in finding mean, median, mode and range with this 21-question quiz! The quiz includes fill-in-the-blank, multiple choice, and open-response questions, as well as real-life applications. Students will also be asked to analyze data tables and a bar chart, and calculate the mean, median, mode and range of each data set. An optional challenge activity is included, in which students will be asked to create a data set of their own, place that data into a tabl
Subjects:
Grades:
3rd - 6th
Also included in: Mean, Median, Mode & Range MEGA BUNDLE
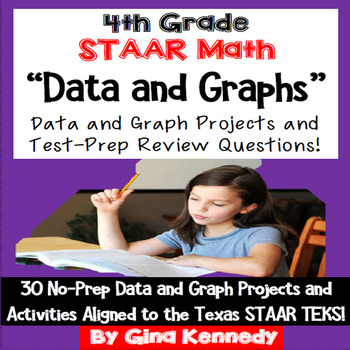
4th Grade STAAR Math Data and Graphs,30 Enrichment Projects & Test-Prep Problems
No-prep, 4th grade STAAR data and graphs practice with 30 enrichment projects and 30 test-prep questions aligned to the TEKS. A great way to teach these important data standards in a fun, engaging way. Great for early finishers, advanced learners and whole class practice. Print and go math enrichment! This resource includes thirty 4th grade STAAR data and graphs problem solving test-prep questions and 30 no-prep data and graphs enrichment projects aligned to the STAAR 4th grade TEKS: 4.9A, 4.9B
Subjects:
Grades:
4th
Types:
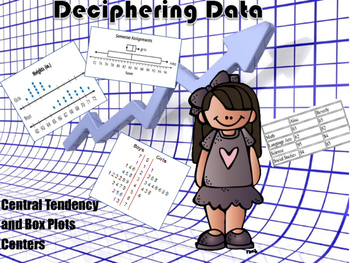
Central Tendency & Box Plots Centers with Mean Absolute Deviation
This is a collection of centers that I created for review. There are five central tendency centers, five box plots centers, and five mean absolute deviation centers. Each card has several questions that require calculations and analyzing information. I printed them out on card stock paper and made cards out of them with the answers on the back of each card. This is a great way to review these concepts.
Subjects:
Grades:
4th - 8th
Types:
CCSS:
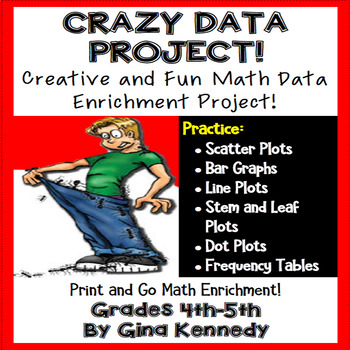
Data Project, Crazy Data Math Enrichment Project!
Data And Graphs Enrichment Project For Upper Elementary! With this project, your students will love making up their own data based on a chosen topic from a provided list. Once they've chosen their topic from such funny themes such as "ants in the pants', they will begin creating their data graphs based on the step-by-step directions included with this project. The students will then begin creating questions for other students to answer based on the data presented in their graphs. A fun way ha
Subjects:
Grades:
4th - 5th
Types:
Also included in: Math Projects "BUNDLE"! Print and Go Math Enrichment All Year!
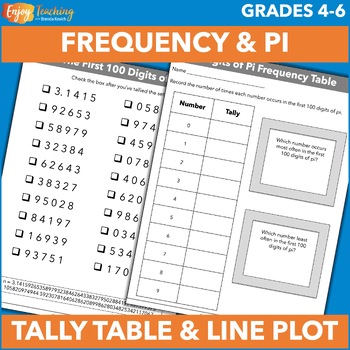
Pi Day Math Activity - Tally Tables, Frequency Tables & Line Plots
Analyze the first 100 digits of pi! Kids organize raw data on tally and frequency tables. Then they create line plots and see which numbers appear most often. It’s a great math activity for Pi Day – or anytime!Open the preview to take a closer look at this upper elementary project.First, teach or review simple data analysis strategies. Three instructional pages make it easy.Using a simple example, kids learn how to use hash marks to organize raw data in a tally table.Then they see how easy it is
Subjects:
Grades:
4th - 6th
Types:
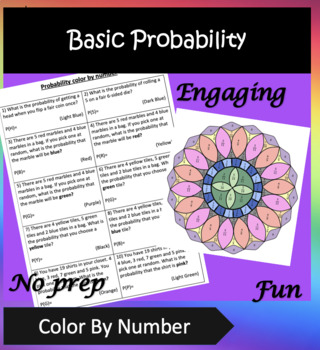
Basic Probability Color By Number Activity - Engaging NO PREP
This coloring worksheet includes 10 questions on basic probability (no simplifying).Students should answer the question then color in the image corresponding to answer.This activity is fun, engaging and a great way to work on fine motor skills.Can be used as homework, classwork, summary activity and more.Answer key is included.If you like this activity please leave a review :) You will also earn TPT credits.
Subjects:
Grades:
4th - 9th
Types:
Halloween Math "Data and Graphs" Projects
NO-PREP! Students will love the Halloween "themed" math data and graphs projects in this resource. From bar graphs,stem-and-leaf plots, line plots to line graphs and more, the projects are a fun way to apply data skills to real-life Halloween data. With the projects in this resource, your students will be researching such data as calories in fun size candy bars to the top pumpkin producing countries in the world. I've also included an example sheet for each type of graph used in the resource
Subjects:
Grades:
4th - 5th
Types:
Fidget Spinner Math (line plot, probability, tree diagram)
Use these fidget spinner math activities to engage students in their learning!
What's included-
*Fidget spinner probability tree diagram
*6 different spinner boards activity--kids can spin their fidget spinner to figure out probability
*fidget spinner line plot activity
Great for end of the year activity!
Please leave me a feedback to let me know what you think! Thank you!!
Check out my other probability activity worksheets and my probability bundle to save money!
Coin, Dice, Colored Tiles P
Subjects:
Grades:
3rd - 8th
Types:
Also included in: Probability Activity BUNDLE
Mean, Median, Mode & Range Scavenger Hunt
Looking for a way to get your students out of their seats and engaged in the content? This scavenger hunt is just what you've been looking for to help students calculate mean, median, mode and range! Perfect for extra practice or a review before an assessment! The questions included are meant to be posted around the room. Students will then start at a question, working either independently, with a partner, or with a group. Once the question has been answered, students will search the room for th
Subjects:
Grades:
3rd - 6th
Types:
Also included in: Mean, Median, Mode & Range MEGA BUNDLE
Showing 1-24 of 38 results


