389 results
Statistics Common Core 8.SP.A.1 resources
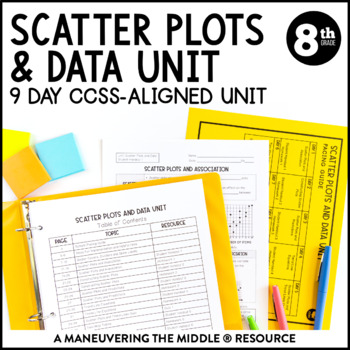
Scatter Plots and Data Unit | 8th Grade Math | Line of Best Fit Notes
A 9 day CCSS-Aligned Scatter Plots and Data Unit - including scatter plots, trend lines, two-way tables and relative frequency.Students will practice with both skill-based problems, real-world application questions, and error analysis to support higher level thinking skills. You can reach your students and teach the standards without all of the prep and stress of creating materials!Standards: 8.SP.1, 8.SP.2, 8.SP.3, 8.SP.4; Texas Teacher? Grab the TEKS-Aligned Scatter Plots and Data Unit. Please
Subjects:
Grades:
8th
Types:
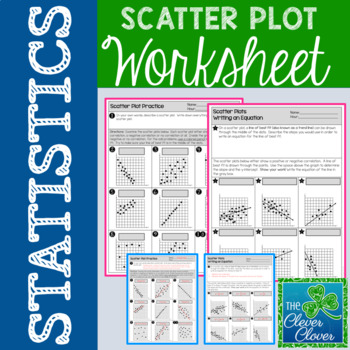
Scatter Plot Worksheet
Scatter Plot Worksheet
This resource allows students to explore scatterplots with a two page worksheet. Students are asked to define scatterplots in their own words. Nine questions ask students to identify the type of correlation (positive, negative or no correlation) that exists between two variables. Students are also asked to describe the steps used to write an equation for the line of best fit. Six additional questions require students to calculate the slope and determine the y-intercept
Subjects:
Grades:
6th - 9th, Adult Education
Types:
CCSS:
Also included in: Scatter Plot Mini-Bundle
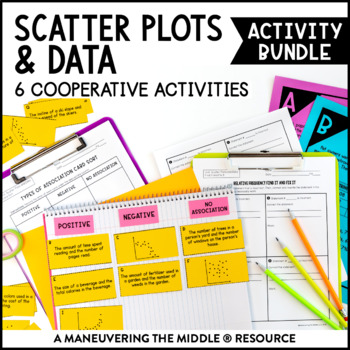
Scatter Plots and Data Activity Bundle | Trend Lines Activities for 8th Grade
This Scatter Plots and Data Activity Bundle includes 6 classroom activities to support 8th grade scatter plots and two-way tables. These hands-on and engaging activities are all easy to prep! Students are able to practice and apply concepts with these scatter plots and two-way table activities, while collaborating and having fun! Math can be fun and interactive!Standards: CCSS (8.SP.1, 8.SP.2, 8.SP.3, 8.SP.4) and TEKS (8.5C, 8.5D, 8.11A)More details on what is included:Six hands-on activities t
Subjects:
Grades:
8th
Types:
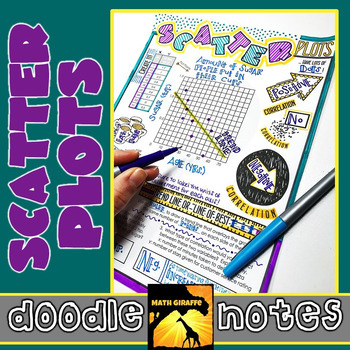
Scatter Plots Doodle Notes
Creating & Analyzing Scatter Plots - Visual Interactive "Doodle Notes"
When students color or doodle in math class, it activates both hemispheres of the brain at the same time. There are proven benefits of this cross-lateral brain activity:
- new learning
- relaxation (less math anxiety)
- visual connections
- better memory & retention of the content!
Students fill in the sheets, answer the questions, and color, doodle or embellish. Then, they can use it as a study guide later on.
C
Subjects:
Grades:
7th - 8th
CCSS:
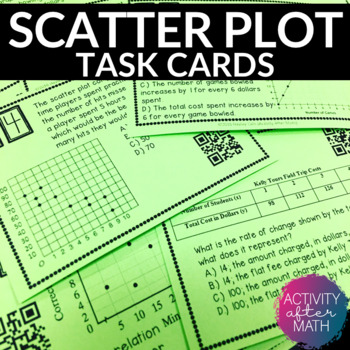
Scatter Plots and Line of Best Fit Task Cards with QR Codes
Get your students involved with practicing Interpreting Data with Scatter Plots and Line of Best Fit! Task cards include multiple choice problems and constructed response. Click here to SAVE and get this as a Task Cards BUNDLEThis resource includes:Teacher InstructionsTeacher TipsStudent Instructions24 Task cards with QR codes24 Task cards without QR codesBlank Answer Document for studentsAnswer Key for easy gradingOptions for using this resource:You can print the ones with QR codes for students
Subjects:
Grades:
8th - 9th
Types:
Also included in: 8th Grade MATH TASK CARDS BUNDLE
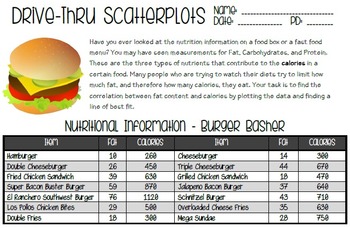
Drivethru Scatter Plots - Line of Best Fit Activity
This activity is a fun way to work with scatter plots in a realistic situation. Students will compare the fat and calories in items from a fictional fast food restaurant by creating a scatter plot. They will also draw a line of best fit, approximate the slope of that line, and make predictions based on the line.
Included:
*Drive-Thru Scatterplots Activity
*Answer Key
Please leave feedback with any suggestions for improvements! :)
Subjects:
Grades:
8th - 9th
Types:
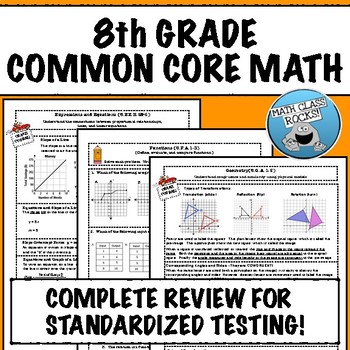
8TH GRADE MATH COMMON CORE REVIEW
If you need to prepare your students for a standardized test based on the Common Core, this “crash course” is exactly what you need! Organized by standard and easy to use, just print and let the reviewing begin! What's Included?This download consists of 10 “crash course” reviews with explanations and examples. Every "crash course" is followed by a practice assessment comprised of items aligned with standardized state tests. The Number SystemKnow that there are numbers that are not rational, a
Subjects:
Grades:
7th - 9th
Types:

Oscar Winner -- Data Analysis & Statistics Inquiry - 21st Century Math Project
Utilize the last twenty years of Oscar winners as a data set to guide your students through creating box and whisker plots, histograms, and exploring mean, median, and mode -- in one 21st Century Math Project!Does the age of the award winning star in a film relate to the overall gross of the movie? Student will explore this inquiry question and use the data to support their conclusion.In this 8 page document you will be given a mapping to the Content Standards, an outline for how to implement t
Subjects:
Grades:
6th - 12th
Types:
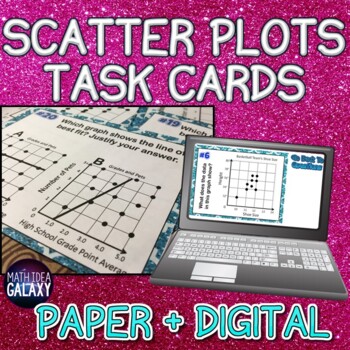
Scatter Plots Task Cards- Printable & Digital Resource
This is an engaging activity for students to practice reading and interpreting scatterplot graphs. Students will practice scatter plots in a variety of ways; these task cards can be used as a game, a center or station, a whole class activity, independent work, or partner practice for concepts related to scatter plots and the line of best fit.These task cards come in both printable AND digital formats. The digital format is built in Google Slides to easily assign to students, and includes answers
Subjects:
Grades:
6th - 8th
Types:
CCSS:
Also included in: Scatter Plots Activity Bundle
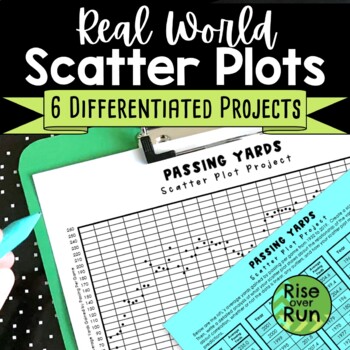
Scatter Plot Project with Real World Sports Data
Practice creating and analyzing scatter plots with these six differentiated real world projects. Students are provided statistics for a sport and must graph the data. Then, they write an analysis describing correlation, whether or not the data is linear, any outliers, and how the scatter plot might be used to make predictions. The scatterplots range from 38 points to 149 points, so they can be used to differentiate. The scatter plots will take a little time to plot, but they result in real
Subjects:
Grades:
8th - 9th
Types:
CCSS:
Also included in: 8th Grade Math Activities & Lessons Bundle for the Whole Year
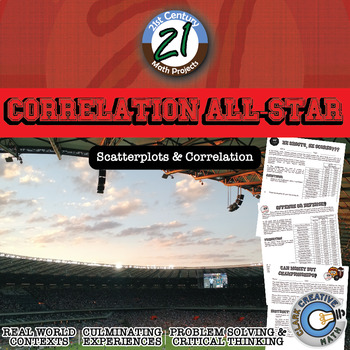
Correlation All-Star -- Sports Data Analysis - 21st Century Math Project
Bring an authentic sports-based math project to your Algebra, Algebra 2 or PreCalculus classroom with Lines of Best Fit and Correlations! All in this 21st Century Math Project! Using data from the MLB, NBA, NFL and NHL students investigate correlations to some of sports most common questions like: "Do more shots result in more goals?" "Do hitters or pitchers have more impact on a team's wins?""What NFL stat is most strongly correlated with wins?" and the grand-daddy..."Can money buy championship
Subjects:
Grades:
7th - 12th
Types:
CCSS:
Math March Madness Full Tournament Project {BUNDLE}
Harness the excitement of NCAA March Madness with this huge project for secondary math teachers that follows all stages of the tournament! This Common Core aligned bundle comes with bonus parts not sold individually in my store so you can create a rich immersion in the tournament, practice probability and statistics and learn some interesting new ones along the way! Save $3 plus get bonus content by bundling!You can pick and choose which parts you would like to incorporate, or follow my schedu
Subjects:
Grades:
6th - 12th, Higher Education
Types:
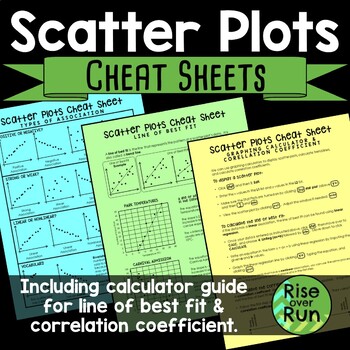
Scatter Plot Cheat Sheets Printable Guided Notes
Detailed sheets for the following topics: •Types of Association & VocabularyThis page shows examples of positive, negative, strong, weak, linear, and nonlinear association. It also shows clusters and outliers.•Line of Best FitThis page explains what a line of best is (or trend line) along with examples and nonexamples. It has 2 real world connections and how to interpret the line of best fit.•Graphing Calculator Guide & Correlation CoefficientThis sheet gives step by step instructions fo
Subjects:
Grades:
8th - 9th
CCSS:
Also included in: 8th Grade Math Activities & Lessons Bundle for the Whole Year
Scatterplots Two Way Tables and Residual Plots Worksheets Bundle
Six math worksheets and one quiz targeting widely tested state math standards focusing on Bivariate Data concepts including Scatterplots and Two-Way Tables, Relative Frequency Tables and Residuals. Each include a printable PDF, Five include corresponding Easel Activities.WorksheetsScatterplots WorksheetLine of Best Fit WorksheetTwo Way Tables WorksheetRelative Frequency Tables WorksheetResiduals and Residual Plots WorksheetTwo-Way Relative Frequency by Totals WorksheetQuiz Two Way TablesMr. Slo
Subjects:
Grades:
8th
Types:
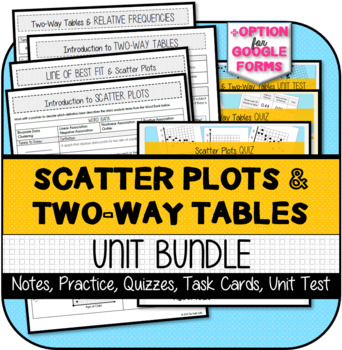
Scatter Plots & Two-Way Tables UNIT BUNDLE
This bundle contains:1) Notes with Practice Problems2) Test Practice 3) Supplementary Activities4) Quizzes (with options for Google Forms)5) Review Task Cards 6) Unit Test (with option for Google Forms)This resource was developed to meet the requirements of the 8th Grade Statistics & Probability Standards below:CCSS.MATH.CONTENT.8.SP.A.1 Construct and interpret scatter plots for bivariate measurement data to investigate patterns of association between two quantities. Describe patterns such a
Subjects:
Grades:
7th - 9th
8th Grade Statistics Project- Scatter Plots: Analyzing Asthma
I created this project as a fun way for my 8th grade students to apply their knowledge of scatter plots in a meaningful way. They had a lot of fun!Students pretend to be biostatisticians investigating why asthma rates in a city are skyrocketing. Students get to uncover the environmental cause of the increased rates of asthma and investigate how different factors are associated with asthma attacks.Students get lots of practice: - creating scatter plots using a table of data- selecting an appropri
Subjects:
Grades:
8th - 10th
Types:
CCSS:
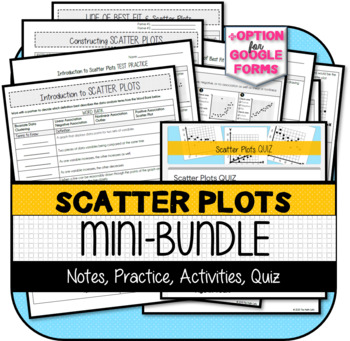
Scatter Plots MINI-BUNDLE
This resource contains the following items:1) Notes with Practice Problems2) Activities (Constructing Scatter Plots & Matching Line of Best Fit)3) Test Practice4) Quiz5) Answer KeysThis resource was developed to meet the requirements of the 8th Grade Statistics & Probability Standards below:CCSS.MATH.CONTENT.8.SP.A.1 Construct and interpret scatter plots for bivariate measurement data to investigate patterns of association between two quantities. Describe patterns such as clustering, out
Subjects:
Grades:
7th - 9th
Types:
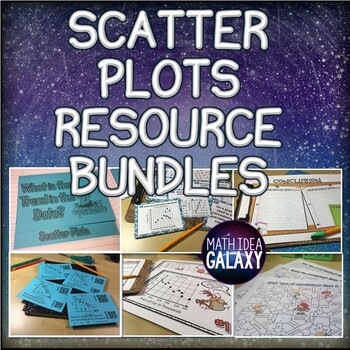
Scatter Plots Activity Bundle
This is a collection of games, activities, and notes that will engage your students in learning about scatter plots. This is the perfect addition to your class and will give students more practice with scatterplots and can be used for differentiation, centers and stations, homework and bellringers.
Subjects:
Grades:
8th
Types:
CCSS:
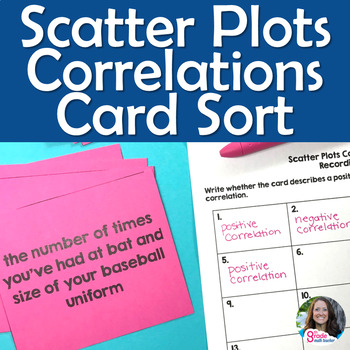
Scatter Plots Correlation Association Card Sort Activity or Task Cards
Get your students thinking with this scatter plots activity! This resource has 32 cards for students to investigate patterns of association (correlations) between two quantities (plus 4 blank cards). Use these as a card sort or task cards.Card sort: Students work in pairs or groups to sort the cards into 3 piles (positive association, negative association, or no association). As they sort, they give their reasoning why each card goes into the particular pile.Task cards: Students can work individ
Subjects:
Grades:
8th
Types:
CCSS:
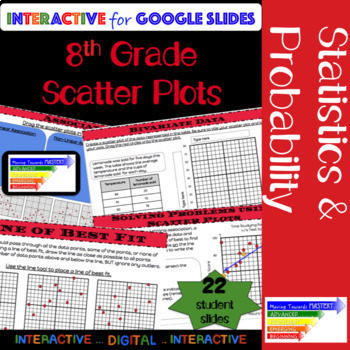
8th Grade Math Scatter Plot: Guided Interactive Lesson
Extensive ALL digital guided lesson for constructing and interpreting scatter plots.The slides are scaffolded to build understanding. Students will progress from identification of terms to making predictions involving bivariate data. The guided slides will begin with identification, move towards assisted analysis, and conclude with independent practice.Slides include...♦ Definitions and Visual Representations♦ Identification and Use of Terms→ Bivariate Data→ Scatter Plot→ Linear, Nonlinear, &
Subjects:
Grades:
8th - 10th
Types:
CCSS:
Also included in: 8th Grade Math Common Core Growing Bundle
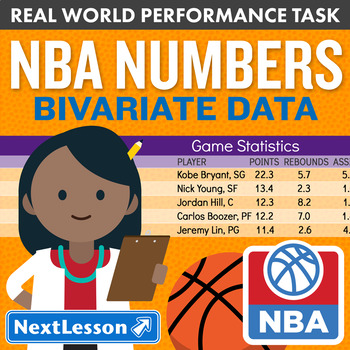
Bundle G8 Bivariate Data / Scatterplots - NBA Numbers Performance Task
Bundle of 29 editions of NBA Numbers Performance Task for 8th grade
In the NBA Numbers Performance Task, students use real data on the players in their favorite basketball team to practice interpreting a scatter plot and finding the equation for the line of best fit, and to extend into constructing a scatter plot from a set of data in an engaging, real world context. Students take on the role of a statistical analyst for the team and determine which player statistics are related to help make im
Subjects:
Grades:
8th
Types:
8th Grade Math End of Year Review Digital Self-Checking Activity Bundle
This bundle of 5 engaging digital activities will provide your 8th grade math students with instant feedback as they solve problems related to all CCSS Grade 8 Math standards.This self-checking, auto-grading Google Sheets activity is just what you need for:Test Prep for Standardized AssessmentsWrapping up at the end of the Data unitReviewing all learning for grade 8 concepts and skills at the end of the school yearStudents will answer each problem by typing their answer in the appropriate space
Subjects:
Grades:
8th
Types:
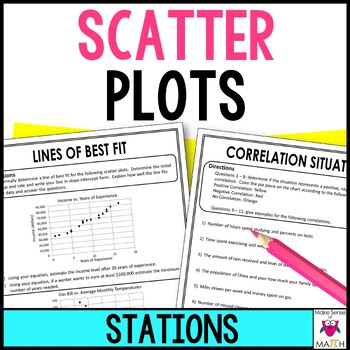
Scatter Plots Stations Activity | Lines of Best Fit, Correlation & Analyze
These math stations delve into scatter plots with a focus on correlation and informally analyzing lines of best fit. Students will create, analyze, estimate and explain. Students will develop a deep understanding of this content after completing these math stations. The following stations are included:Create and Analyze: Students will create and analyze a scatter plot. Noticing correlation, outliers and clusters. Lines of Best Fit: Students are given a scatter plot and are to informally dra
Subjects:
Grades:
8th - 9th
Types:
Also included in: Middle School Math Stations Bundle | Math Centers
8th Grade Math Review & Quizzes | Homework or Warm Ups | 3rd QUARTER
This 8th Grade math spiral review resource can easily be used as math HOMEWORK, WARM UPS, or a DAILY MATH REVIEW! This resource was designed to keep math concepts fresh all year and to help you easily track student progress. All pages are 100% EDITABLE and easy to differentiate to fit your students' needs.Get the ENTIRE YEAR BUNDLE! {CLICK HERE} ☝☝ Check out the Preview for more details and 3 FREE Weeks! ☝☝This Spiral Review System is also available for LANGUAGE (Grammar & Word Study)Go 100%
Subjects:
Grades:
8th
Types:
Showing 1-24 of 389 results


