23 results
Common Core HSS-ID.B.5 resources for Microsoft PowerPoint
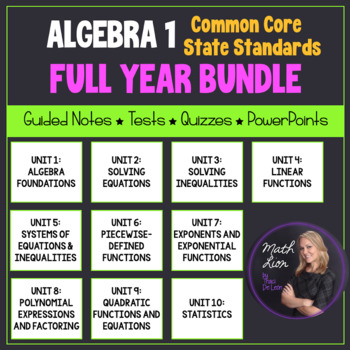
Algebra 1 Curriculum - Full Year EDITABLE Unit Plans | Bundled for Common Core
This is a great bundle that covers concepts for a full year Algebra 1 course! 76 lessons are included! Documents are EDITABLE!Included:- Overview of the common core alignment tandards (Two 18-week guides) (PDF and Word) - Overview of the common core alignment (PDF)- Guided notes for 76 lessons (PDF and Word)- PowerPoint presentations (aligned with guided notes) (PPTX)-10 Mid-unit quizzes (PDF and Word)-10 Unit tests (PDF and Word)-2 Semester exams (PDF and Word)Each lesson contains a learning
Grades:
8th - 12th
CCSS:
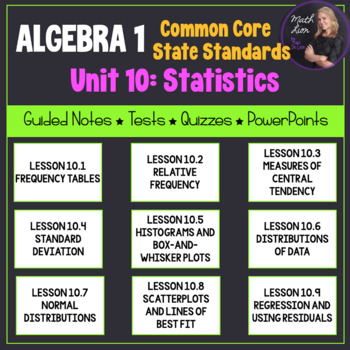
Statistics (Algebra 1 Curriculum - Unit 10) | Bundle for Common Core
This is a great unit that covers a Statistics unit in an Algebra 1 course! 9 lessons are included!All documents are EDITABLE!Included:- Overview of the common core alignment (PDF)- Guided notes for 9 lessons (PDF and Word)- PowerPoints that coordinate with the guided notes (PPTX)- Mid-Unit Quiz (PDF and Word)- Unit Test (PDF and Word)-Pacing Guide (PDF and Word)Each lesson contains a learning scale, warm up (do-now or bell ringer), key concepts, vocabulary, and examples for students to follow w
Subjects:
Grades:
7th - 12th
CCSS:
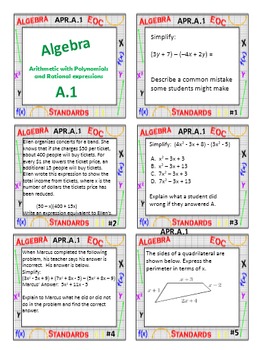
Algebra 1 Review Task Cards
This product covers the domains of Algebra, Functions, Numbers and Quantity, and Probability and Statistics, and includes:
- Task Cards by standard (306 total questions)
- Answer Keys by standard
- Student answer sheets
Each standard adopted by Louisiana for Algebra 1 is covered, however cards can easily be used in other states and by non-CCSS states.
These task cards are a great way to review throughout the year as well as at the end of the year before end of course tests. This allows stu
Subjects:
Grades:
7th - 10th
CCSS:
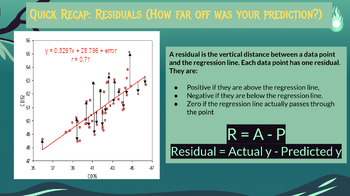
Lesson 3: Two Variable Data: Statistics (correlation, regressions, scatter plot)
Hello!This is a lesson (powerpoint) on two-variable data. It includes vocabulary and guided practice on how to create scatter plots, calculate and interpret correlation, and write regression lines. This lesson should span through two weeks. You can find supplementary activities to this lesson on my storefront! If you teach StatsMedic, it's aligned to the cadence of StatsMedic lessons and activities. This resource is best downloaded to Google Drive and then edited as needed for your students. Ple
Subjects:
Grades:
10th - 12th
Types:
CCSS:
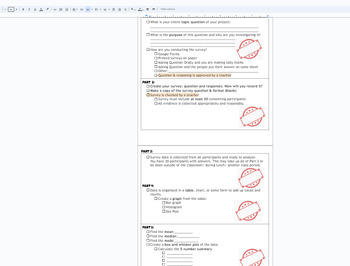
Statistics Survey project Discovery (broken down into sections) with Rubric
This is a broken down (scaffolded) packet of instructions/ guide for a Stats Project for Math 1 HS or 8th grade students. The goal of the project is for students to take a statistical survey on quantitative data (numbers) of their choice. Using this data from the survey, the following will be included in the project:Survey- the question being askedSurvey responses (requirement of 30)Data organization: Bar chart, Histogram, Dot PlotMeanMedianModeBox and Whisket Plot5 number summary (Q1,Q2,Q3, min
Subjects:
Grades:
7th - 12th, Higher Education, Adult Education
CCSS:
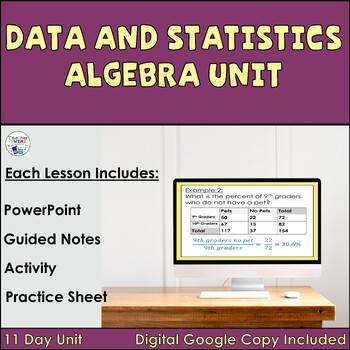
Data and Statistics for Algebra Unit
Make lesson planning easy with this no-prep Data and Statistics for Algebra Unit! Included are 11 ready-made lessons. This unit is very easy to use and will save you a lot of time!Use the Data and Statistics for Algebra Unit to cover Algebra 1/Math 1 data and statistic topics. You will enjoy the ease of using our editable PowerPoints with guided notes. Students will love the Algebra lessons when you use the included activities for each lesson! Great Algebra Lessons to use for Home School!The Dat
Grades:
8th - 9th
CCSS:
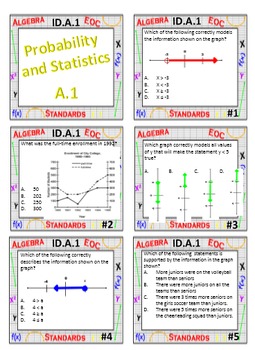
Algebra 1 Review Task Cards - Probability and Statistics
This product covers the domain of Probability and Statistics for Algebra 1 and includes:
- Task Cards by standard (50 total questions)
- Answer Keys by standard
- Student answer sheets
Each standard adopted by Louisiana for Algebra 1 in the Probability and Statistics domain is covered, however cards can easily be used in other states and by non-CCSS states. For a a FREE checklist and description of the standards, please check our store.
These task cards are a great way to review throughout th
Subjects:
Grades:
7th - 10th
Types:
CCSS:
(Alg 1) Data Analysis and Displays {Bundle} in a PowerPoint Presentation
Algebra 1 Data Analysis and Displays {Bundle} in a PowerPoint PresentationThis is a bundle include the eight PowerPoint lessons below and two Quiz Show games, Jeopardy Style, for review.Measures of Central Tendency S.ID.2, S.ID.3Measures of Dispersion (Standard Deviation) S.ID.2, S.ID.3Box-and-Whisker Plots S.ID.1, S.ID.2, S.ID.3Shapes of Distributions S.ID.2, S.ID.3Quiz Show Game Central Tendencies and Dispersion S.ID.1, S.ID.2, S.ID.3Scatter Plots and Lines of Fit 8.SP.1, S.ID.6a, S.ID.6c, S
Grades:
8th - 10th
CCSS:
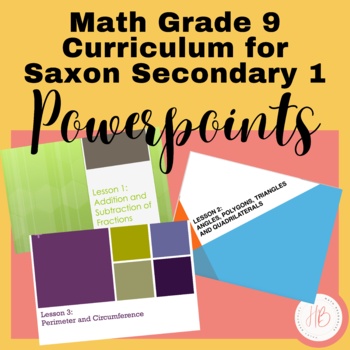
9th Grade Saxon Secondary 1 Math Powerpoints
These 120 Powerpoint lessons work hand in hand with the Saxon Algebra 1 math textbook. If you do not teach the Saxon program then these Powerpoints can be used to help teach the Secondary 1 Common Core. Each Powerpoint consists of a lesson overview which includes formulas and direct instructions. After that there are several practice problems that allows students to put into practice what they just learned. This is a great opportunity for group work as well as for the teacher to walk around the
Grades:
8th - 9th
Types:
CCSS:
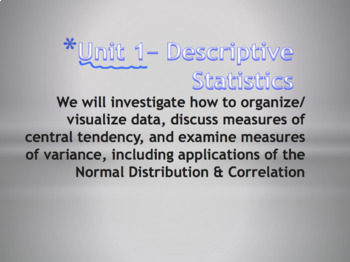
Statistics Unit 1 Bundle - Introduction to Statistics Curriculum (8 days)
Statistics Unit 1 Bundle - Intro to Statistics Curriculum (8 days)This is an Introductory Unit for a Statistics class. The plans include common core math standards, time frame, activities, enduring understandings, essential questions, and resources used. It is designed to last 8 days, depending on pacing. The plans include: 22-slide presentation, with annotated guide for reference2 Worksheets"Do Now" Entrance problemsUnit ReviewUnit QuizUnit 1 Project - Gathering DataPacing guide with administra
Subjects:
Grades:
9th - 12th, Higher Education
CCSS:
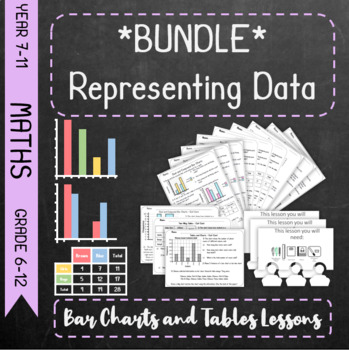
*Bundle* Representing Data - Bar Charts and Tables *Bundle*
This is a bundle featuring the following individual resources:Charts & TablesTwo-Way TablesDual and Compound Bar ChartsThese lessons are based around the scheme of work laid out by the Pearson Key Stage 3 Maths Progress DeltaCharts & Tables - Lesson on Frequency and Tally Tables and Bar ChartsTwo-Way Tables - Lesson on Two-Way TablesDual and Compound Bar Charts - Lesson on Dual/Comparative and Compound/Composite Bar Charts
Grades:
5th - 12th
CCSS:
Constants, Variables, & Level of Measurement Animated PPT w/ Scaffolded Notes
This constants, variables, and level of measurement resource contains an interactive and animated PowerPoint with matching scaffolded style notes for your scientific method or statistics unit. There is a Tip & Tricks slide and corresponding note page that compiles feedback, notes, and helpful information I have personally seen benefit my students.Please be aware that this lesson was designed for a criminal justice-based statistics course; as such, topics and applied word problems use related
Subjects:
Grades:
Not Grade Specific
CCSS:
NGSS:
HS-LS3-3
Univariate Stats: Frequency Distribution Table, Animated PPW & Knowledge Checks
This Univariate Statistics: Frequency Distribution Table resource contains an interactive and animated PowerPoint for your scientific method or statistics unit. You can also purchase the matching scaffolded notes. There is a Tip & Tricks slide and corresponding note page that compiles feedback, notes, and helpful information I have personally seen benefit my students.Please be aware that this lesson was designed for a criminal justice-based statistics course; as such, topics and applied word
Subjects:
Grades:
Not Grade Specific
CCSS:
NGSS:
MS-LS4-6
Constants, Variables, & Level of Measurement Animated PPW, Knowledge Checks
This constants, variables, and level of measurement resource contains an interactive and animated PowerPoint for your scientific method or statistics unit. You can also purchase the matching scaffolded notes. There is a Tip & Tricks slide and corresponding note page that compiles feedback, notes, and helpful information I have personally seen benefit my students.Please be aware that this lesson was designed for a criminal justice-based statistics course; as such, topics and applied word prob
Subjects:
Grades:
Not Grade Specific
CCSS:
NGSS:
HS-LS3-3
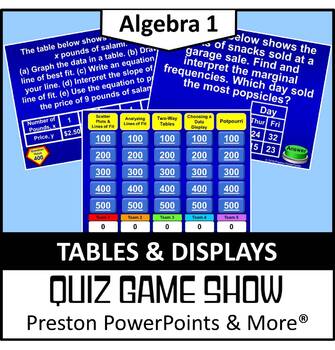
(Alg 1) Quiz Show Game Tables and Displays in a PowerPoint Presentation
Algebra 1 Quiz Show Game Tables and Displays in a PowerPoint PresentationThis Quiz Show game, Jeopardy Style, is a great way to review a chapter. There are 25 questions and a scoreboard so you don’t have to write it on a side board. Each page has the point value!This Quiz Show game covers all of the following:Scatter Plots and Lines of Fit 8.SP.1, S.ID.6a, S.ID.6c, S.ID.7Analyzing Lines of Fit S.ID.6b, S.ID.7, S.ID.8, S.ID.9Two-Way Tables 8.SP.4, S.ID.5Choosing a Data Display S.ID.1NEW: The les
Grades:
8th - 10th
CCSS:
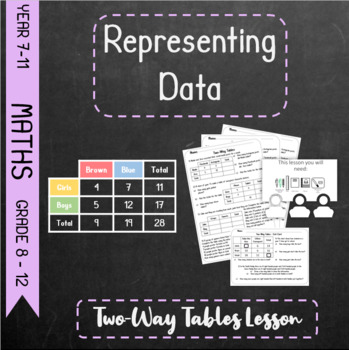
Representing Data - Two-Way Tables Lesson
This resource consists of differentiated lessons, worksheets and print offs. The lessons are a set of 3 differentiations of the same lesson in PowerPoints form as well as a mixed version to allow you to differentiate on the fly. The worksheets are a set of 3 differentiations with some overlap in both PDF and PowerPoint form for easy editting. There is also an undifferentiated exit card for assessment purposes. This is a PDF.Finally there is a variety of print offs that can be used as lesson aids
Subjects:
Grades:
7th - 12th
CCSS:
Also included in: *Bundle* Representing Data - Bar Charts and Tables *Bundle*
LSRL, Regression and Correlation PPT Review Activity (Stat/AP Statistic) No prep
Get ready to supercharge your statistics lesson with this dynamic activity! Your students will have the opportunity to practice finding least square regression lines, correlation, r values, coefficient of determination, and residuals in a fun and engaging way. With 21 questions and answers conveniently displayed on a PowerPoint presentation, you can easily post them on the board for all to see. Perfect for Statistics and AP Statistics classes, this activity will help reinforce key concepts and b
Subjects:
Grades:
9th - 12th
CCSS:
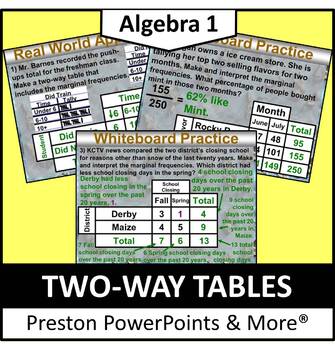
(Alg 1) Two-Way Tables in a PowerPoint Presentation
Algebra 1 Two-Way Tables in a PowerPoint PresentationThis slideshow lesson is very animated with a flow-through technique. I developed the lesson for my Algebra 1 class, but it can also be used for upper level class reviews. This lesson teaches how to read two-way tables, find marginal frequencies, make and interpret two-way tables, and use graphs to organize and solve real-life data problems, such as the most liked movie genre.This lesson has SKELETON NOTES, notes that have the problem only.
Grades:
8th - 10th
CCSS:
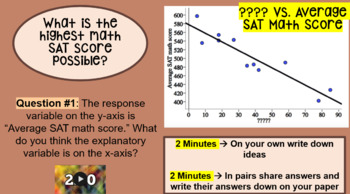
Stats: Inequities in Student Achievement & Poverty (PPT, NOTE SHEET-KEY, CFU)
Empower students to be able to interpret relevant data and make informed decisions based upon that data.Activity Based Learning where students experience first and then formalize their thoughts later.Extremely relevantMath discourse- a lot of room for conversation and critical thinkingProblem solving, reasoning, representation, communication, and connections … Oh my!When and Whereo Pre-Algebra/Algebra 1/Algebra 2: Linear Functions and Equationso Data and Statistics: Analyzing Two-Variable Datao
Subjects:
Grades:
9th - 12th
CCSS:
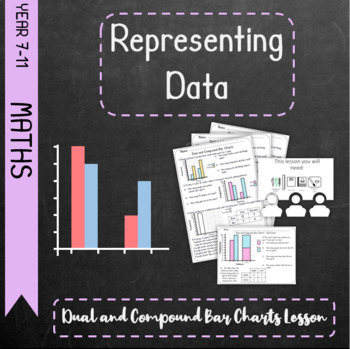
Representing Data - Dual and Compound Bar Charts Lesson
This resource consists of differentiated lessons, worksheets and print offs. The lessons are a set of 3 differentiations of the same lesson in PowerPoints form as well as a mixed version to allow you to differentiate on the fly. The worksheets are a set of 3 differentiations with some overlap in both PDF and PowerPoint form for easy editting. There is also an undifferentiated exit card for assessment purposes. This is a PDF.Finally there is a variety of print offs that can be used as lesson aids
Subjects:
Grades:
5th - 12th
CCSS:
Also included in: *Bundle* Representing Data - Bar Charts and Tables *Bundle*

Samples and Populations
This lesson will allow students to understand the concept of Samples and Populations. It has the content and videos which will provide students an engaging lesson. It also has links to an online survey that you as the teacher can conduct and control (This will need to be adapted to suit your specific class). Also included is question examples and activities for the students to engage with. The lesson goes through the following topics: samples, populations, surveys, census questionnaires and coll
Subjects:
Grades:
7th - 9th
CCSS:
Lesson 1 PowerPoint: One Variable Data for Statistics: Dot Plots, Histograms,etc
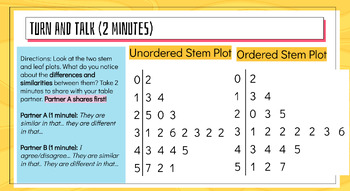
This is a lesson (on powerpoint) about statistical distributions. The lesson includes practice problems and vocabulary relating to dot plots, stem plots, and describing/comparing statistical distributions. This is for secondary math (high schoolers). It includes some data collection activities and requires students to get involved in the lesson. If you teach with a tablet, iPad, or smart board, this template is writing-friendly. You can write on the presentation or edit it as you need for your c
Subjects:
Grades:
9th - 12th, Adult Education
Types:
CCSS:
Organizing and Visualizing Data: Population, Sample, Frequency, Graphs and Plots
z
Subjects:
Grades:
8th - 12th
CCSS:
Showing 1-23 of 23 results

