186 results
7th grade statistics interactive whiteboards
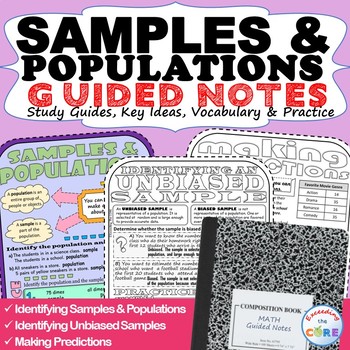
SAMPLES & POPULATIONS Doodle Math - Interactive Notebooks (Guided Notes)
- Great for online learning and distance learning!Have your students use these SAMPLES & POPULATIONS Guided Notes to review key ideas and essential vocabulary . Guided Notes aid in student focus, concept retention, engagement and creativity. Using this resource will allow students to synthesize this math concept and create their own tangible connections in their notes. Guided Notes Includes:__ Key Ideas with Verbal & Numerical Examples__ Essential Vocabulary with Definitions__ Skills Pr
Subjects:
Grades:
6th - 8th
Also included in: 7th GRADE MATH Assessments, Warm-Ups, Task Cards, Worksheets BUNDLE
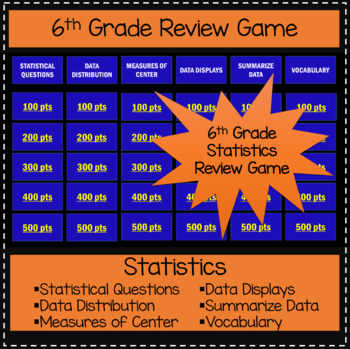
6th Grade Statistics - Game Show Review Game
This is the perfect way to review your 6th grade statistics unit!Students will love this Jeopardy-like game to review the Statistics standards. This game is aligned with Common Core standards. Categories include STATISTICAL QUESTIONS, DATA DISTRIBUTION, MEASURES OF CENTER, DATA DISPLAYS, SUMAMRIZE DATA, AND VOCABULARY. Points range from 100 - 500, which reflect the increase in difficulty from 100-point basic review questions to 500-point questions that require students to apply their knowledge.*
Subjects:
Grades:
5th - 7th
Also included in: 6th Grade Game Show Review Games BUNDLE
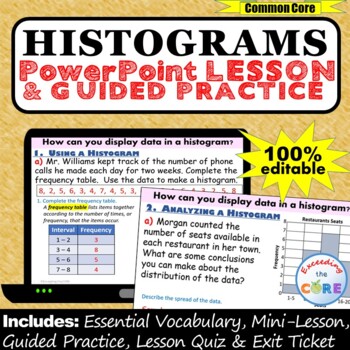
HISTOGRAMS and FREQUENCY TABLES PowerPoint Lesson AND Guided Practice - DIGITAL
Great for online learning and distance learning!Get your students successfully creating and using HISTOGRAMS and Frequency Tables with this PowerPoint Presentation. This lesson begins with a focused mini-lesson and guided practice questions. It concludes with a lesson quiz and exit ticket to assess student understanding. All of the answers are included. This PowerPoint presentation is 100% editable, therefore you can modify any slide as needed.What is Included:_ Mini-Lesson with Guided Practice
Subjects:
Grades:
6th - 8th
CCSS:
7th Grade Probability 2 - Compound Event Powerpoint Lesson
Seventh Grade Probability 2 - Compound Event Powerpoint Lesson is powerful when used as direct instruction in the classroom, on-line, or individually. It teaches the students to find the compound event three different ways: through multiplication, making a tree, and making a list using a table. The following probability terms are taught and reviewed: probability, event, trial, scale of probability, sample space, simple event, experiment, experimental probability. There are 22 effective teac
Subjects:
Grades:
7th
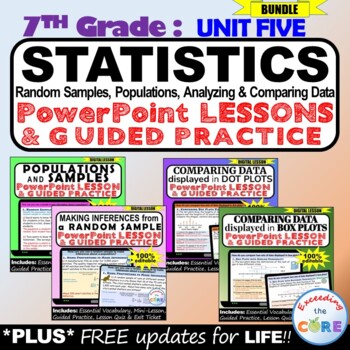
STATISTICS: 7th Grade PowerPoint Lessons DIGITAL BUNDLE
- Great for online learning and distance learning!Get your students to successfully understand the 7th Grade STATISTICS UNIT (random samples and populations, making inferences, analyzing and comparing data ) with this PowerPoint Presentation BUNDLE.This bundle includes 4 PowerPoint Lessons that are designed to teach students how to use samples to gain information about a population. Students will also be able to compare and analyze data in dot plots and box plots.These lessons cover the entire
Subjects:
Grades:
6th - 8th
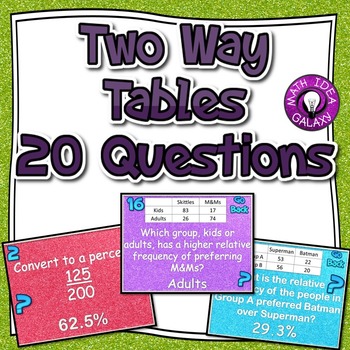
Two Way Tables 20 Questions for Interactive Whiteboard
This is an engaging class activity to review concepts related to reading two way tables. The whole class will answer 20 questions and try to figure our a secret picture at the same time.
This resource includes:
-Game board for projector
-Student scorecard
-20 content questions
-A secret character
-20 questions to help reveal the secret character
Subjects:
Grades:
6th - 8th
CCSS:
Also included in: Two Way Tables Activities Bundle
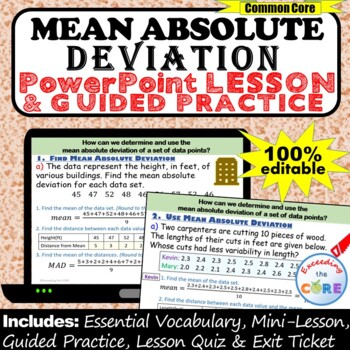
MEAN ABSOLUTE DEVIATION (MAD) PowerPoint Lesson & Practice | Distance Learning
Great for online learning and distance learning!Get your students successfully finding the MEAN ABSOLUTE DEVIATION (MAD) with this PowerPoint Presentation. This lesson begins with a focused mini-lesson and guided practice questions. It concludes with a lesson quiz and exit ticket to assess student understanding. All of the answers are included. This PowerPoint presentation is 100% editable, therefore you can modify any slide as needed.What is Included:_ Mini-Lesson with Guided PracticeThe mini-
Subjects:
Grades:
5th - 7th
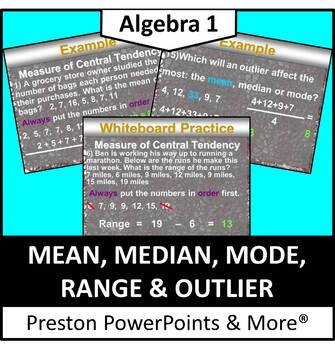
Mean, Median, Mode, Range and Outlier in a PowerPoint Presentation
Mean, Median, Mode, Range and Outlier in a PowerPoint PresentationThis slideshow lesson is very animated with a flow-through technique. It was made for my Algebra 1 class, but can be used for lower grades aw well. The lesson teaches how to solve for mean, median, mode and range. It also teaches to identify outliers in a set of data and find the measure of central tendency.NEW: The lesson is in an editable format so you can tailor the lesson to your class. The problems and clipart can’t be edit
Subjects:
Grades:
6th - 10th
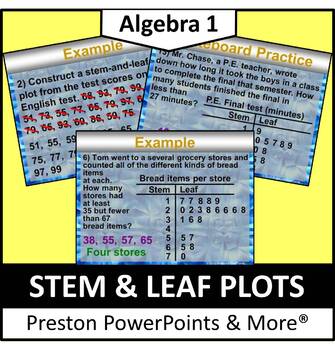
Stem and Leaf Plots in a PowerPoint Presentation
Stem and Leaf Plots in a PowerPoint PresentationThis slideshow lesson is very animated with a flow-through technique. I developed it for my Algebra 1 class, but it can be used for lower grades as well. This lesson was one of a chapter that was used as a review for all previous grades. The lesson teaches how to interpret data from the stem-and-leaf plot and make and use a stem-and-leaf plot to put data in order.NEW: The lesson is in an editable format so you can tailor the lesson to your class.
Subjects:
Grades:
6th - 9th
CCSS:
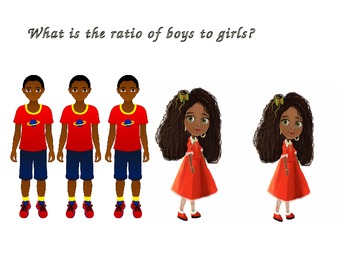
Ratios & Proportional Relationships Powerpoint 6.RP.A.1
Ratios are so much fun! Introduce ratios and proportional relationships with this fun powerpoint. Students can also complete the worksheet that goes along with this activity. Check out my store for the worksheet that is differentiated according to student's ability.
Subjects:
Grades:
5th - 7th
PROBABILITY: 7th Grade PowerPoint Lessons DIGITAL BUNDLE
Get your students to successfully understand the 7th Grade PROBABILITY Unit (experimental and theoretical probability) with this PowerPoint Presentation BUNDLE.This bundle includes 7 PowerPoint Lessons that are designed to teach students how to describe the likelihood of simple and compound events. Students will also be able to make predictions with experimental and theoretical probability.These lessons cover the entire PROBABILITY unit. Each lesson starts with a mini-lesson and guided practice
Subjects:
Grades:
6th - 8th
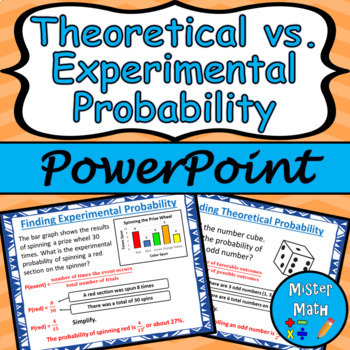
Theoretical vs. Experimental Probability PowerPoint Lesson
This is a PowerPoint Presentation to assist students in learning about theoretical and experimental probability. Students will learn the concepts of theoretical and experimental probability, as well as how to find the probabilities of each. Overall, the 21-slide PowerPoint Lesson covers the following topics:Theoretical ProbabilityUsing Theoretical ProbabilityExperimental ProbabilityMaking PredictionsComparing Theoretical & Experimental Probability Plenty of real-life examples are included to
Subjects:
Grades:
6th - 9th
Also included in: Theoretical vs. Experimental Probability PPT & Guided Notes BUNDLE
Statistics and Probability PowerPoint Presentation: 6.SP.1-5
This product contains 13 instructional slides related to concepts about statistics and probability in a PowerPoint presentation. The PowerPoint correlates to the "foldables" and posters in my other CCSS 6.SP products. It is just formatted differently, but the content is the same.NOTE: This product is also a part of my Complete Packaged Unit (All practice sheets, foldables, PowerPoint, Posters, Assessments, and Task Cards)!Visit Suzanne's Classroom Store! The resources are designed to enrich o
Subjects:
Grades:
5th - 7th
Also included in: Statistics and Probability: CCSS 6.SP.1-5 Bundle
Categorical Data vs Numerical Data Flip Chart
In this flip chart, students will learn the difference between categorical data and numerical data, examples, and key vocabulary. The activinspire flip chart allows the teacher to reveal the information by removing the shapes over the correct information. At the end of the lesson are five questions which the students have to classify as categorical or numerical.
Grades:
5th - 8th
Types:
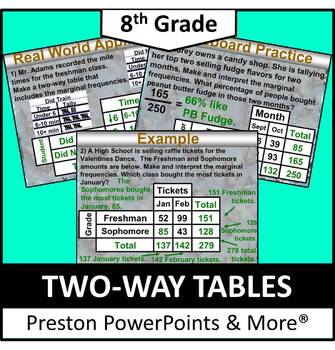
(8th) Two-Way Tables in a PowerPoint Presentation
8th Grade Math (Pre-Algebra) Two-Way Tables in a PowerPoint PresentationThis slideshow lesson is very animated with a flow-through technique. I developed the lesson for my 8th grade class, but it can also be used for upper level class reviews. This lesson teaches how to read two-way tables, make and interpret two-way tables, and use graphs to organize and solve real-life data problems, such as the most liked movie genre.This lesson has SKELETON NOTES, notes that have the problem only. I used t
Subjects:
Grades:
7th - 9th
CCSS:
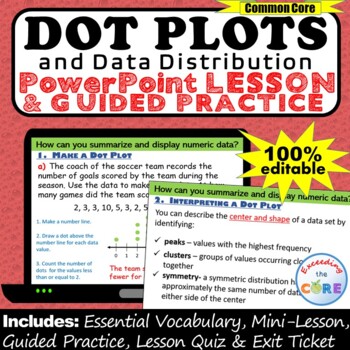
DOT PLOTS, LINE PLOTS & DATA DISTRIBUTION PowerPoint Lesson & Practice | Digital
Great for online learning and distance learning!Get your students successfully creating and using DOT PLOTS /LINE PLOTS and Data Distribution with this PowerPoint Presentation. This lesson begins with a focused mini-lesson and guided practice questions. It concludes with a lesson quiz and exit ticket to assess student understanding. All of the answers are included. This PowerPoint presentation is 100% editable, therefore you can modify any slide as needed.What is Included:_ Mini-Lesson with Gui
Subjects:
Grades:
6th - 8th
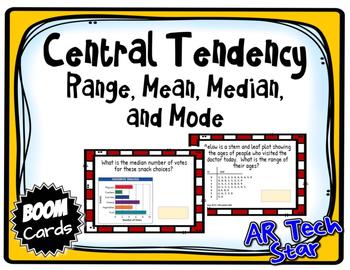
Central Tendency - Range, Mean, Medan, and Mode Boom Cards Distance Learning
This set of 20 interactive, digital task cards is designed to provide practice of measures of central tendency - range, mean, median, and mode. The first five cards address a poem to help students remember the measures of central tendency, and vocabulary questions in multiple choice format. The remaining cards are word problems with data given in stem and leaf plots, dot plots, bar graphs, data sets, and data tables where students will respond by typing in answers. We love Boom Cards and my k
Subjects:
Grades:
5th - 7th
Also included in: Math Boom Card Bundle Gr 3-6 - Distance Learning
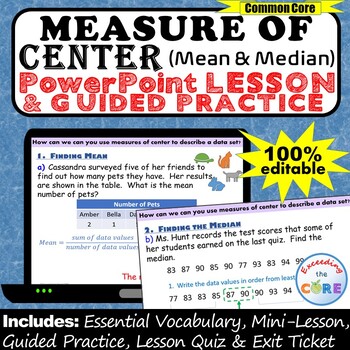
MEASURE OF CENTER (Mean, Median) PowerPoint Lesson & Practice |Distance Learning
Great for online learning and distance learning!Get your students successfully finding the MEASURE OF CENTER (Mean and Median) with this PowerPoint Presentation. This lesson begins with a focused mini-lesson and guided practice questions. It concludes with a lesson quiz and exit ticket to assess student understanding. All of the answers are included. This PowerPoint presentation is 100% editable, therefore you can modify any slide as needed.What is Included:_ Mini-Lesson with Guided PracticeThe
Subjects:
Grades:
5th - 7th
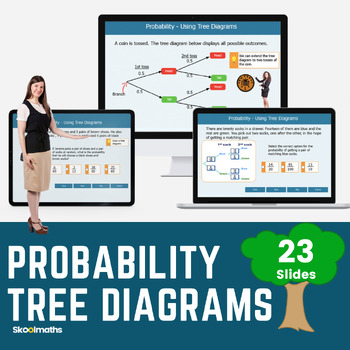
Probability Tree Diagrams Interactive Digital Resources CCSS.7.SP.C.5
Probability Tree Diagrams Interactive Lesson and Activities CCSS.7.SP.C.5Engage your middle school math class with this amazing interactive lesson plan which is focused on teaching probability tree diagrams, aligned with the Common Core State Standard 7.SPC.5. It includes self-marking activities and instructions designed to help middle school students understand and apply the concept of probability through tree diagrams. The interactive elements involve hands-on activities, digital simulations,
Subjects:
Grades:
7th - 8th
Also included in: High School Statistics and Probability Bundle
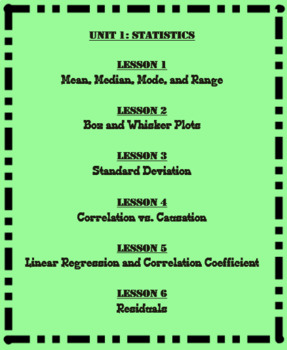
Unit 1-Statistics (Math 1)
This is the first Unit of the eight Units that I cover in Math 1. This unit is broken up in to six different lessons that are listed below. Each lesson includes a SMART Notebook presentation, a student note-taking guide, and an answer key. Also included in this unit are student flashcards, a test outline, and a 25 question multiple choice test.
Unit 1: Statistics
Lesson 1: Mean Median Mode Range Outliers and Skew
Lesson 2: Box and Whisker Plots
Lesson 3: Standard Deviation
Lesson 4: Correlati
Subjects:
Grades:
6th - 12th
CCSS:
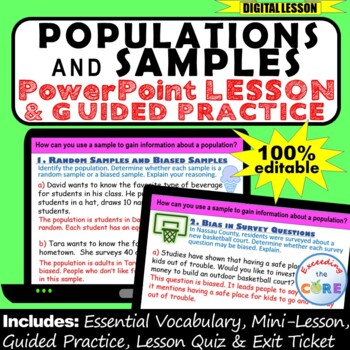
POPULATIONS AND SAMPLES PowerPoint Lesson & Guided Practice | Distance Learning
Great for online learning and distance learning!Get your students successfully solving problems involving POPULATIONS AND SAMPLES using this PowerPoint Presentation. This lesson begins with a focused mini-lesson and guided practice questions. It concludes with a lesson quiz and exit ticket to assess student understanding. All of the answers are included. This PowerPoint presentation is 100% editable, therefore you can modify any slide as needed.What is Included:✔️Mini-Lesson with Guided Practic
Subjects:
Grades:
6th - 8th
CCSS:
Also included in: STATISTICS: 7th Grade PowerPoint Lessons DIGITAL BUNDLE

Halloween Math Powerpoint Quiz - FUN CLASS ACTIVITY
A fully animated Halloween maths quiz with sound. Updated 2016.. This is a quiz for teams of children working together solving problems. Order pumpkins by weight; work out how many frogs and spiders are in the cauldron; match the ghostly frames using enlargement; calculate mean, median, mode and range to compare pumpkin patches; and finally go trick or treating using factors, primes and multiples. Click the drop down pumpkin to return to the score sheet. Click the witch to move to next slide.The
Subjects:
Grades:
4th - 7th
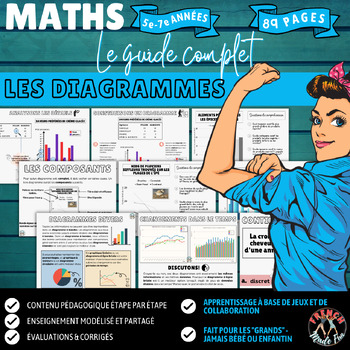
FRENCH MATHS | SANS CAHIER/PAPERLESS | DIAGRAMMES/CHARTS | REPRESENTATION
Having trouble visualizing how to "break down" math concepts and how to structure your teaching? New to this grade level or unfamiliar with "how" to teach it? Tired of passing out worksheets? If you're wanting to try something else to see if your students become more engaged and confident in math... Look no further. No book? No problem. Printer broken? No problem. Multi-levelled or split classrooms? No problem.Imagine math classes that require zero prep, zero paper, zero planning, and slides whi
Subjects:
Grades:
5th - 7th
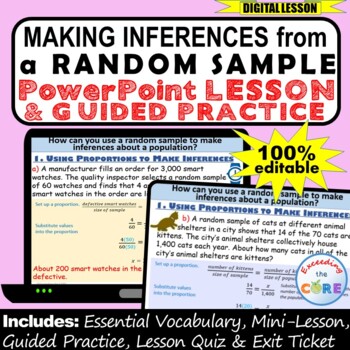
MAKING INFERENCES: RANDOM SAMPLE PowerPoint Lesson, Practice | Distance Learning
Great for online learning and distance learning!Get your students successfully solving problems involving MAKING INFERENCES FROM A RANDOM SAMPLE using this PowerPoint Presentation. This lesson begins with a focused mini-lesson and guided practice questions. It concludes with a lesson quiz and exit ticket to assess student understanding. All of the answers are included. This PowerPoint presentation is 100% editable, therefore you can modify any slide as needed.What is Included:✔️Mini-Lesson with
Subjects:
Grades:
6th - 8th
Also included in: STATISTICS: 7th Grade PowerPoint Lessons DIGITAL BUNDLE
Showing 1-24 of 186 results


