6 results
Not grade specific Common Core 8.SP.A.1 resources
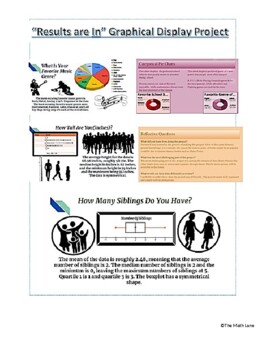
"The Results are In" Graphical Display Stats End of Year Project (All Grades)
Get ready to take your data analysis skills to the next level with our Graphical Display Project! Designed for students who want to create visually stunning displays of their data, this project allows you to not only collect data using Google Surveys, but also analyze and present it using Google Sheets. With detailed instructions, project examples, and a comprehensive rubric included, you'll have everything you need to create professional-looking graphical displays of both numerical and categori
Subjects:
Grades:
Not Grade Specific
Types:
CCSS:
Also included in: High School Math Projects (Algebra II and Statistics) STEM No prep
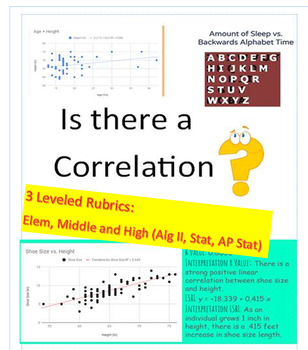
Correlation? Data Project (3 Rubrics_Elem/Middle School/ AP Stats) EOY
Get ready to supercharge your students' data analysis skills with this dynamic project! Perfect for end of year or semester project. In this engaging activity, students will have the exciting opportunity to collect their own data through surveys, online research, or real world data sets. They will then dive deep into the world of statistics as they determine if there is a correlation between two variables. With three different leveled rubrics, this project is perfect for students of all ages an
Subjects:
Grades:
Not Grade Specific
Types:
CCSS:
Also included in: High School Math Projects (Algebra II and Statistics) STEM No prep
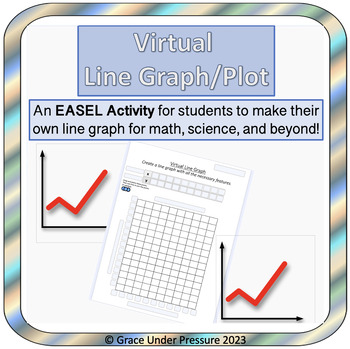
Virtual Line Graph or Scatter Plot Template: EASEL ONLY
This product is a virtual (EASEL) line graph or scatter plot template that can be used for graphing data from math, science, social studies, psychology, or other subjects.You can type in the ordered pairs ahead of time, or you can have your students type them into the (x,y) chart. Then, they have to use the ordered pairs to make a line graph or scatter plot:• Type in a title• Label x & y axis• Choose an appropriate scale and enter it on each axis• Drag and drop the circles as data points• Us
Subjects:
Grades:
Not Grade Specific
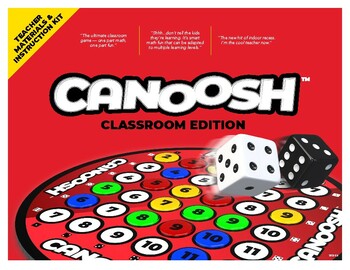
Canoosh Dice Probability Game — Complete (7 Games)
Canoosh is a collection of fast-action, easy-to-learn classroom dice games based on a simple two-dice probability chart. It was designed to be inclusive of any age/learning ability and integrates healthy competitive fun with a range of math learning concepts:Addition and subtractionFractionsProbability and statisticsStrategyCanoosh Classroom Edition is designed to be projected on a wall or chalkboard. You can use it with an entire class, divided into teams, in smaller group play, or as the new f
Subjects:
Grades:
Not Grade Specific
Types:
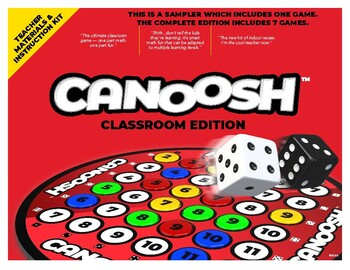
Canoosh Dice Probability Game (1-Game Sampler)
Canoosh is a collection of fast-action, easy-to-learn classroom dice games based on a simple two-dice probability chart. It was designed to be inclusive of any age/learning ability and integrates healthy competitive fun with a range of math learning concepts:Addition and subtractionFractionsProbability and statisticsStrategyCanoosh Classroom Edition is designed to be projected on a wall or chalkboard. You can use it with an entire class, divided into teams, in smaller group play, or as the new f
Subjects:
Grades:
Not Grade Specific
Types:
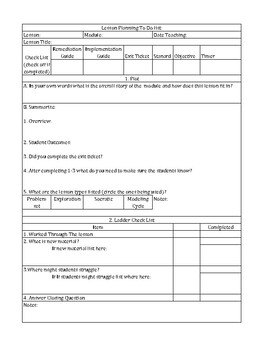
Eureka Math/Engage NY Lesson Plan Set Up and Reflection
Breaking down the lessons for Eureka Math or Engage NY can become daunting. With this CCSS aligned curriculum it is important that we stick to the lesson give with fidelity. However, this is not always easy to communicate on a lesson plan. I have take Eureka Materials and developed a lesson plan outline to help you create and implement your Eureka Math/Engage NY lesson plan.
Grades:
Not Grade Specific
Showing 1-6 of 6 results

