14 results
Common Core 8.SP.A.2 videos
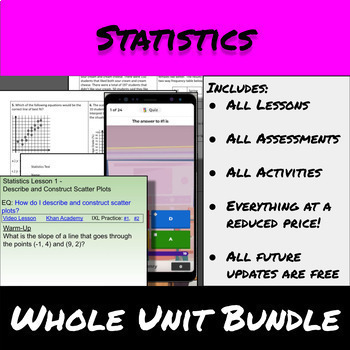
Statistics-Whole Unit Bundle
This bundle includes EVERYTHING needed to teach the unit on Statistics with scatter plots and two-way frequency tables for 8th grade students.Included are:all lessons(with video lesson, homework, and worked out solutions)all worksheets free and paidall activitiesall assessmentsYou get all unit resources at 20% off. Purchase now and you also get any future updates and new resources free without having to purchase them as all new resources will be added to the bundle.Free Updates:12/1/2023: Added
Subjects:
Grades:
7th - 10th
Types:
13:10
Scatter Plots Video Lesson with Student Notes
This video lesson teaches students.... * that a scatter plot is a graph of points that show the relationship between two sets of data. * How to find the line of best fit, or trend line * How to identify positive and negative correlation * How to interpolate or extrapolate data predictions from a scatter plot (and the difference between these two terms)Note: Time is not taken for students to create their own scatter plots in this lesson. You receive not only the instructional video but accompanyi
Middle School Statistics and Probability Video BUNDLE
Served to you on a silver platter is this BUNDLE of Middle School Statistics and Probability Videos!Always served on Mrs. Butler’s Silver Platter: ✓content is broken down ✓content is repeated ✓easy-to-work-with numbers ✓suitable for pre-teaching, review & remediation ✓used by special education teachers & parents “Supporting Document” for videos is currently my Terms of Use and my Many Thanks to you! ♥ Remember that #BundlesAreBest! This BUNDLE is offered to save YOU money! *cha chi
25:27
Scatter Plots Video Lesson with Guided Notes
This video lesson is perfect for sub plans, class activities, math centers, remedial help, or flipping your class. This video lesson teaches students about scatter plots. In particular, your students will be able to...Explain the terms scatter plot, trend line, linear regression, correlation, interpolation, and extrapolation Draw a trend lineExplain how the correlation coefficient portrays how strong the correlation isIdentify positive and negative correlation, strong and weak correlation given
Subjects:
Grades:
8th - 9th
Types:
CCSS:

Measures of Central Tendency and Data Displays Video BUNDLE
Served to you on a silver platter is this BUNDLE of VIDEOS all about measures of central tendency AND data displays used in 6th grade, 7th grade, and 8th grade math!Always served on Mrs. Butler’s Silver Platter: ✓content is broken down ✓content is repeated✓easy-to-work-with numbers ✓suitable for pre-teaching, review & remediation✓used by special education teachers & parents “Supporting Document” for videos is currently my Terms of Use and my Many Thanks to you! ♥Remember that #BundlesAre

Data Displays Video BUNDLE
Served to you on a silver platter is this BUNDLE of VIDEOS all about data displays used in middle school math!Always served on Mrs. Butler’s Silver Platter: ✓content is broken down ✓content is repeated✓easy-to-work-with numbers ✓suitable for pre-teaching, review & remediation✓used by special education teachers & parents “Supporting Document” for videos is currently my Terms of Use and my Many Thanks to you! ♥Remember that #BundlesAreBest! This BUNDLE is offered to save YOU money! *cha ch
8th grade Statistics and Probability Video BUNDLE
Served to you on a silver platter is this BUNDLE of VIDEOS all about statistics and probability in 8th grade math!Always served on Mrs. Butler’s Silver Platter: ✓content is broken down ✓content is repeated✓easy-to-work-with numbers ✓suitable for pre-teaching, review & remediation✓used by special education teachers & parents “Supporting Document” for videos is currently my Terms of Use and my Many Thanks to you! ♥Remember that #BundlesAreBest! This BUNDLE is offered to save YOU money! *ch
Subjects:
Grades:
8th
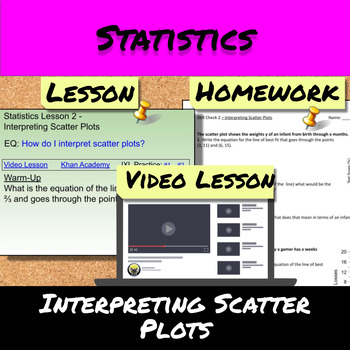
Statistics-Lesson 2-Interpreting Scatter Plots
In this lesson students will learn how to use the equation for the line of best fit to intrepret scatter plots. The lesson includes 18 problems with multiple parts over 15 slides in Google Slides. The skills covered in this lesson are:Write the equation of the line of best fit for a scatter plotUse the line of best fit(equation and line) to answer questions and make predictionsProblem solve with the skills aboveAlso included with this lesson is a full length Youtube video of this lesson being
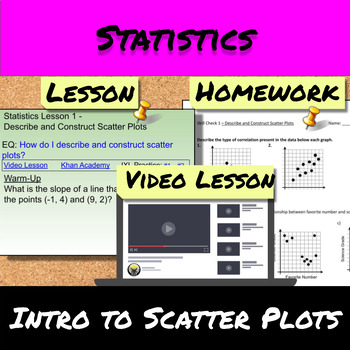
Statistics-Lesson 1-Intoduction to Scatter Plots
In this lesson students will learn how to describe and construct scatter plots. The lesson includes 13 problems over 16 slides in Google Slides. The skills covered in this lesson are:Identify scatter plots with linear, nonlinear, positive, negative, and no correlationConstruct scatter plots from dataLocate and identify gaps, clusters, and outliers from a scatter plotProblem solve with the skills aboveAlso included with this lesson is a full length Youtube video of this lesson being taught. The
16:37
Scatter Plots Video
Looking for an engaging VIDEO to break down rigorous math content? Served to you on a silver platter is Scatter Plots Video! This 8th grade VIDEO about scatter plots is here to build your student’s foundation. What’s Included: →Introduction to scatter plots, showing examples and vocabulary →Vocabulary: scatter plot, trend, correlation, association, positive, negative, no association, strength, strong, weak, shape, linear, nonlinear, outlier, cluster, line of best fit, trend line →Real world exam
Subjects:
Grades:
8th
Also included in: Data Displays Video BUNDLE
6:41
Distance Learning Math: Scatterplots (Two Variable Data Sets)
This instructional video reviews how a scatterplot is used to determine a relationship between two variables. The video reviews how a two variable data set can also be displayed using circle graphs and double bar graphs. Three different scatterplots show the three kinds of relationships that potentially exist with two variables: positive, negative, and no relationship. The possibility of outliers is also addressed. Like my other instructional math videos, music and gifs help to make the mate
Subjects:
Grades:
7th - 9th
Also included in: Distance Learning Math: Data Management Resource Package

Math Test Review/Prep Problems/Starters Grade 5 - 10
This Playlist of short videos are taken from released State End of the Year assessments for Grades 5, 6, 7, 8, 9 and 10. These problems check for understanding relative to what every student should know and be able to do. Each video is ONE question from a Common Core Aligned State Assessment. Each question is read and a modeled exemplar solution follows. Studies are showing that video instruction provides a more engaging sensory experience than print resources, an increase of knowledge rete

Free Middle School Math Problem Videos - Grades 5 - 10
This Playlist of short videos are taken from released State End of the Year assessments for Grades 5, 6, 7, and 8. These problems check for understanding relative to what every student should know and be able to do. Each video is ONE question from a Common Core Aligned State Assessment. Each question is read and a modeled exemplar solution follows. Studies are showing that video instruction provides a more engaging sensory experience than print resources, an increase of knowledge retention,
1:44
What happens during an internet minute: a data management activity
The following video shows 6 different infographics from 2015-2020. Each infographic looks at some of the numbers behind the most popular apps and services on the internet. Students get to connect with their own experience, predict trends, and see if there is a relationship with some of the data be constructing a scatter plot using two variables. A rubric for teachers is attached.
Subjects:
Grades:
7th - 9th
Types:
Also included in: Distance Learning Math: Data Management Resource Package
Showing 1-14 of 14 results

