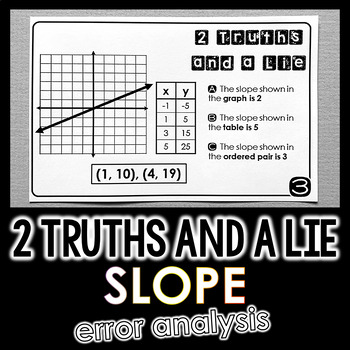
"2 Truths and a Lie" Slope Math Error Analysis Activity
- PDF
What educators are saying
Also included in
- This bundle of error analysis math activities will engage your students and really make them think about their math. In each of the activities, students identify incorrect statements (the “lies”) and correct them on their answer sheets. Students get practice with the topic of the activity along withPrice $22.00Original Price $84.00Save $62.00
- This big bundle includes 17 printable and digital slope activities to make teaching and reviewing slope engaging and fun with your students. There is lots to choose from in this bundle, from whole-class activities, to partner activities, to activities that can be assigned to students individually. SPrice $23.00Original Price $47.00Save $24.00
Description
This error analysis activity will make your students really think about slope. Students identify incorrect statements about slope shown on graphs, in tables and in ordered pairs. Students are then asked to fix each error.
On each card there is a graph, a table and a pair of coordinates, as well as 3 statements about each representation's slope. Students need to figure out which of the 3 statements is false (the "lie"), then correct the false statement on their answer sheet.
This activity gives students practice reading graphs and finding slope from tables and ordered pairs. It also offers practice recognizing errors when they occur.
There are 10 cards, a student answer sheet and an answer key included.
Browse all slope activities.
You may also like:


