
6th and 7th Grade Statistics Posters for Word Wall BUNDLE


- Zip
Products in this Bundle (2)
Also included in
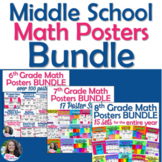 Everything you need for your middle school math word wall! This is the perfect resource for those teaching multiple grade levels. This bundle includes 39 sets of 6th grade, 7th grade, and 8th grade math vocabulary posters.All posters are simple, easy to read, and have all the math information studenPrice $80.00Original Price $118.50Save $38.50
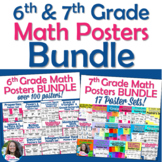 Everything you need for your middle school math word wall! This is the perfect resource for those teaching multiple grade levels. This bundle includes 39 sets of 6th grade and 7th grade math vocabulary posters.All posters are simple, easy to read, and have all the information students need. They arePrice $56.00Original Price $79.25Save $23.25
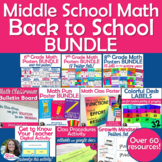 Here is everything you need to start your school year in middle school math! Whether you are a new teacher or switching to grades 6-8 for the first time, this bundle has you covered with vocabulary posters, first day activities, classroom décor, and more! By purchasing this bundle, you save over 35%Price $120.00Original Price $184.75Save $64.75
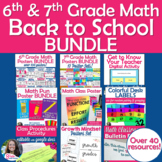 Whether you are a first year teacher or someone switching to 6th & 7th grade math for the first time, this bundle has what you need to get a jump start on your school year!Don't fret over how you are going to decorate your classroom or what you will do on first day of school, this bundle has evePrice $83.00Original Price $124.25Save $41.25
Description
This bundle contains posters sets for both 6th grade and 7th grade statistics. Grab the bundle SAVE!
You get both of these posters sets for a discounted price:
6th Grade Statistics Posters Set for Word Wall
7th Grade Statistics Posters Set for Word Wall
This set of over 20 posters serves to provide visuals and definitions for students during your statistics and data unit! The posters are black and white and can be printed on card stock from your own printer. Hang them on your word wall for students to access the critical vocabulary. They can also be printed as large as 18" x 24" to use as math anchor charts.
The following vocabulary terms are included in this bundle:
- Frequency
- Statistical Question
- Measure of Center
- Measure of Variability
- Categorical Data (or Qualitative)
- Numerical Data (or Quantitative)
- Distribution
- Mean
- Median
- Interquartile Range
- Mean Absolute Deviation
- Range
- Dot Plot (or Line Plot)
- Symmetrical
- Skewed Right
- Skewed Left
- Box Plot (or Box and Whiskers Plot)
- Histogram
- Population
- Sample
- Random Sample
- Representative
Note- Some of the vocabulary terms are included in both sets.
Please follow my store -8th Grade Math Teacher
You may also like...
Statistical Questions Card Sort
Probability Posters Set for Word Wall
8th Grade Statistics Posters Set for Word Wall
