


Scaffolded Math and Science
30.4k Followers
Resource Type
Standards
CCSS8.F.B.4
CCSSHSA-REI.D.10
CCSSHSF-BF.A.1
Formats Included
- PDF
- Google Apps™
Pages
8 pages
Scaffolded Math and Science
30.4k Followers

Includes Google Apps™
The Teacher-Author indicated this resource includes assets from Google Workspace (e.g. docs, slides, etc.).
Also included in
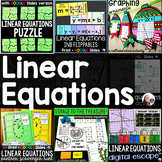 This bundle includes a variety of interactive printable and digital linear equations activities that will keep your students engaged as they are learning, practicing an reviewing linear equations. Inside this bundle are digital math escape rooms, math pennants, a linear equation project, partner scaPrice $27.00Original Price $44.50Save $17.50
Description
This algebra template covers graphing, tables, y-intercept, slope, zeros and writing equations. It will make warm-ups, closers and even quick checks for understanding easy.
The file includes a few versions of the printable template and a link to a digital version in Google Slides.
How I use math templates:
I shine either an equation, table or graph on the board and have students fill in the rest of the fields on their templates. This gives students the opportunity to work with functions in all their forms and convert from one form to the other.
You may also like:
Algebra Word Wall - print and digital
Total Pages
8 pages
Answer Key
N/A
Teaching Duration
N/A
Report this resource to TPT
Reported resources will be reviewed by our team. Report this resource to let us know if this resource violates TPT’s content guidelines.
Standards
to see state-specific standards (only available in the US).
CCSS8.F.B.4
Construct a function to model a linear relationship between two quantities. Determine the rate of change and initial value of the function from a description of a relationship or from two (𝘹, 𝘺) values, including reading these from a table or from a graph. Interpret the rate of change and initial value of a linear function in terms of the situation it models, and in terms of its graph or a table of values.
CCSSHSA-REI.D.10
Understand that the graph of an equation in two variables is the set of all its solutions plotted in the coordinate plane, often forming a curve (which could be a line).
CCSSHSF-BF.A.1
Write a function that describes a relationship between two quantities.
Reviews
Questions & Answers
30.4k Followers
