TPT
Total:
$0.00

Bucketball Experiment Activity & Task

Rated 5 out of 5, based on 3 reviews
5.0 (3 ratings)
617 Downloads
;
Absolute Value
442 Followers
Grade Levels
8th - 10th, Homeschool
Resource Type
Standards
Formats Included
  • PDF
Pages
18 pages
Absolute Value
442 Followers

Description

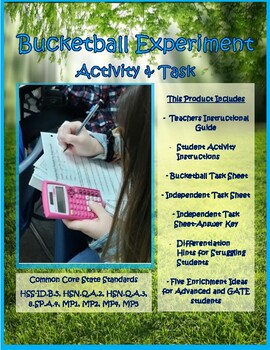
The Bucketball Experiment Activity & Task gives students an opportunity to practice gathering random data, organizing that data into a table, and then determining the relative frequency of the data in a context that is fun and personal. This activity/task has two parts. First students participate in the Bucketball Experiment Activity and record their raw data. Once that is completed and shared between teams, students will partner up to complete the second part, Bucketball Experiment Task. This task asks students to complete a two-way frequency table and then use the results to find solutions.

Students will:

1. Participate in the Bucketball Experiment Activity.

2. Record random data in real time.

3. Organize data into a two-way frequency table.

4. Determine the relative frequency of the collected data.

5. Apply the frequency data to find real solutions.

The Bucketball Experiment Activity & Task is a great activity for the middle of a unit on statistics & probability. Students need to know how to find percentage rates from a fraction before beginning this task. I have students use a calculator to keep the focus on probability and statistics concepts rather than long division. The activity and task take 60 to 90 minutes to complete depending on the mathematical level of the students. Students with average or advanced mathematical skills will complete this task in 60 minutes. Struggling students and English Language Learners may need 90 minutes. This product focuses on Common Core Math Standards: HSS.ID.B.5, HSN.Q.A.2, HSN.Q.A.3, 8.SP.A.4, MP1, MP2, MP4, and MP5.

**************************************************************************************************

Customer Tips: How to get TPT credit for future purchases:

Go to your “My Purchases” page. Next to each purchase, you'll see a “Provide Feedback” button. Simply click it and you will be taken to a page where you can give a quick rating and leave a short comment for the product. Each time you give feedback, TPT gives you feedback credits that you may use to lower the cost of your future purchases. We'd really love it if you'd rate our item after downloading! Feedback is so VERY important!

**************************************************************************************************

Follow my Store

Click on the green star next to my store logo to receive upcoming sales, freebie and product launches, and email updates!

Here's to a successful year!

Absolute Value

Petty415@gmail.com

For more Project Based Learning with Mathematics available at my store: https://www.teacherspayteachers.com/Store/Absolute-Value. This project was created and provided by Absolute Value.

Total Pages
18 pages
Answer Key
Included
Teaching Duration
1 hour
Report this resource to TPT
Reported resources will be reviewed by our team. Report this resource to let us know if this resource violates TPT’s content guidelines.

Standards

to see state-specific standards (only available in the US).
Understand that patterns of association can also be seen in bivariate categorical data by displaying frequencies and relative frequencies in a two-way table. Construct and interpret a two-way table summarizing data on two categorical variables collected from the same subjects. Use relative frequencies calculated for rows or columns to describe possible association between the two variables. For example, collect data from students in your class on whether or not they have a curfew on school nights and whether or not they have assigned chores at home. Is there evidence that those who have a curfew also tend to have chores?
Define appropriate quantities for the purpose of descriptive modeling.
Choose a level of accuracy appropriate to limitations on measurement when reporting quantities.
Summarize categorical data for two categories in two-way frequency tables. Interpret relative frequencies in the context of the data (including joint, marginal, and conditional relative frequencies). Recognize possible associations and trends in the data.
Make sense of problems and persevere in solving them. Mathematically proficient students start by explaining to themselves the meaning of a problem and looking for entry points to its solution. They analyze givens, constraints, relationships, and goals. They make conjectures about the form and meaning of the solution and plan a solution pathway rather than simply jumping into a solution attempt. They consider analogous problems, and try special cases and simpler forms of the original problem in order to gain insight into its solution. They monitor and evaluate their progress and change course if necessary. Older students might, depending on the context of the problem, transform algebraic expressions or change the viewing window on their graphing calculator to get the information they need. Mathematically proficient students can explain correspondences between equations, verbal descriptions, tables, and graphs or draw diagrams of important features and relationships, graph data, and search for regularity or trends. Younger students might rely on using concrete objects or pictures to help conceptualize and solve a problem. Mathematically proficient students check their answers to problems using a different method, and they continually ask themselves, "Does this make sense?" They can understand the approaches of others to solving complex problems and identify correspondences between different approaches.

Reviews

Questions & Answers

442 Followers