TPT
Total:
$0.00

Comparing Slope Flippable | Math Foldable

Rated 4.68 out of 5, based on 19 reviews
4.7 (19 ratings)
;
Scaffolded Math and Science
30.4k Followers
Grade Levels
7th - 9th
Subjects
Standards
Formats Included
  • PDF
Pages
2 pages
$3.00
$3.00
Share this resource
Report this resource to TPT
Scaffolded Math and Science
30.4k Followers
Also included in
  1. Are you teaching summer school algebra? There are two ways to approach summer school algebra: as a punishment for slacking off all year or as an amazing opportunity to turn math attitudes around! There are reasons for taking either approach, but which has the possibility of changing a kid's life for
    Price $40.00Original Price $72.00Save $32.00

Description

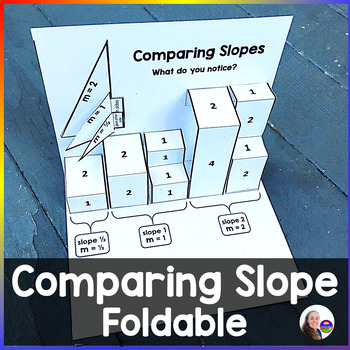
If your students are struggling with slope, they are not alone! This foldable allows students to see slopes 2, 1 and 1/2 and make comparisons and connections between the different rates of change. Slopes 1 and 2 are depicted in two ways each, reinforcing to students that the same slope can sometimes look different.

The foldable is very easy to build and store in student notebooks. It lays totally flat and folds completely in half, allowing students to keep it with them in their notes. The video preview is me putting it together with scissors and a glue stick.

There are 2 versions of the foldable included (both can be seen in the thumbnails and preview). The first version includes an additional 3 triangles that show slopes 2, 1 and 1/2. The triangles get glued on top of one another and can open like a book. Students can compare the triangles to the steps of the foldable and make connections. The second version leaves the triangles out.

You may also like:

Algebra Activities Bundle

Total Pages
2 pages
Answer Key
N/A
Teaching Duration
N/A
Report this resource to TPT
Reported resources will be reviewed by our team. Report this resource to let us know if this resource violates TPT’s content guidelines.

Standards

to see state-specific standards (only available in the US).
Compare properties of two functions each represented in a different way (algebraically, graphically, numerically in tables, or by verbal descriptions). For example, given a linear function represented by a table of values and a linear function represented by an algebraic expression, determine which function has the greater rate of change.
Construct a function to model a linear relationship between two quantities. Determine the rate of change and initial value of the function from a description of a relationship or from two (𝘹, 𝘺) values, including reading these from a table or from a graph. Interpret the rate of change and initial value of a linear function in terms of the situation it models, and in terms of its graph or a table of values.

Reviews

Questions & Answers