TPT
Total:
$0.00

Data Analysis and Statistics Posters and Interactive Notebook INB Set

Rated 4.94 out of 5, based on 58 reviews
4.9 (58 ratings)
;
Amy Alvis
4.1k Followers
Grade Levels
6th - 8th
Standards
Formats Included
  • PDF
Pages
40 pages
$6.00
$6.00
Share this resource
Report this resource to TPT
Amy Alvis
4.1k Followers
Also included in
  1. This bundle includes all of my Poster and foldable interactive graphic organizer (INB) sets that fit 6th grade standards. Each set as at least one interactive graphic organizer for student notes and posters that are 8.5' X 11'. If you have topics that you would like to see created and added to the
    Price $29.40Original Price $36.75Save $7.35

Description

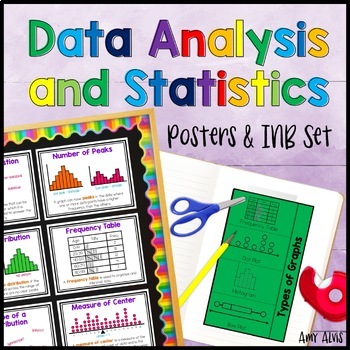
This poster (anchor chart) and interactive notebook (INB) set covers statistical questions, numerical data, categorical data, frequency table, dot plot, histogram, box and whisker plot, box plot, parts of a box and whisker plot, parts or a box plot, measure of center, spread, shape of distribution, symmetry, number of peaks, skewness, uniform distribution, outlier and gaps.

The INB pages cover Types of Graphs, Statistical Questions and Patterns in Data.

It includes 3 different interactive foldable graphic organizers and 17 posters (8.5 X 11) in color and b&w.

Also included are additional posters and INB page for the Box Plot with it being called a Box and Whisker Plot.

Correlates to IN 6.DS.1, 6.DS.2, 6.DS.3, 6.DS.4 and CCSS 6.SP.1, 6.SP.2, 6.SP.3, 6.SP.4

Thank you for looking,

Amy Alvis

Total Pages
40 pages
Answer Key
N/A
Teaching Duration
N/A
Report this resource to TPT
Reported resources will be reviewed by our team. Report this resource to let us know if this resource violates TPT’s content guidelines.

Standards

to see state-specific standards (only available in the US).
Recognize a statistical question as one that anticipates variability in the data related to the question and accounts for it in the answers. For example, “How old am I?” is not a statistical question, but “How old are the students in my school?” is a statistical question because one anticipates variability in students’ ages.
Understand that a set of data collected to answer a statistical question has a distribution which can be described by its center, spread, and overall shape.
Recognize that a measure of center for a numerical data set summarizes all of its values with a single number, while a measure of variation describes how its values vary with a single number.
Display numerical data in plots on a number line, including dot plots, histograms, and box plots.

Reviews

Questions & Answers

4.1k Followers