Finding Slope Puzzle Activity - print and digital
- PDF
- Google Apps™

What educators are saying
Also included in
- This bundle of printable and digital slope activities can be used for practice, review, group work, partner work, and assessment. Slope Sorting ActivitySlope comes in many forms. This activity helps students identify slope when it is presented in different ways. Students work in pairs to cut, sort tPrice $10.00Original Price $14.00Save $4.00
- This big bundle includes 17 printable and digital slope activities to make teaching and reviewing slope engaging and fun with your students. There is lots to choose from in this bundle, from whole-class activities, to partner activities, to activities that can be assigned to students individually. SPrice $23.00Original Price $47.00Save $24.00
- This bundle includes 5 algebra puzzles covering slope, linear equations, inverse functions and quadratics. You can read more about each puzzle in the individual descriptions below:Slope Puzzle - print and digitalStudents cut out 24 puzzle pieces with different representations of slope (graphs, tablePrice $12.50Original Price $15.00Save $2.50
- Teaching slope and functions and on the lookout for fun, interactive activity ideas for your students? This bundle includes a bunch of slope and functions activities, as well as a set of Linear Equations Flippables for the slope, slope-intercept and point-slope equations. The activities inside workPrice $50.00Original Price $94.00Save $44.00
Description
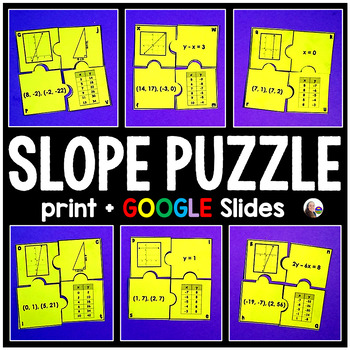
Students cut out 24 puzzle pieces with different representations of slope (graphs, tables, equations, coordinate pairs, right triangles) and fit same-slope pieces together. Each completed puzzle has 4 pieces with a graph, table, coordinate pair and either a right triangle or an equation on each of the pieces.
Now also included is a digital GOOGLE Slides version for students working online. Students match the same puzzle pieces, just on their screen, then share it back with you. The digital version spans 2 slides so that students do not have to move any pieces from one slide to another. Students will complete 3 puzzles on each slide.
When completed, each activity makes 6 completed puzzles with puzzles for slope 0, undefined slope, and slopes 1 through 4. Puzzle pieces are not matched on the sheets so that students can be in charge of cutting them out. The preview is a completed activity printed on colorful paper (actual puzzle pieces are larger, 2 completed puzzles will fit on 1 piece of paper). Includes both print + interactive digital versions
Included in: Algebra Activities Bundle
You may also like:
Slope Digital Math Escape Room
Slope MYSTERY MESSAGE! Tasks - print and digital
Rate of Change (Slope) Solve 'n Check! Tasks - print and digital


