
Functions mini-bundle

Scaffolded Math and Science
30.4k Followers
Resource Type
Standards
CCSS8.F.A.1
CCSS8.F.A.2
CCSS8.F.A.3
CCSS8.F.B.5
Formats Included
- Zip
- Google Apps™
Pages
25 pages
Scaffolded Math and Science
30.4k Followers

Includes Google Apps™
This bundle contains one or more resources with Google apps (e.g. docs, slides, etc.).
Products in this Bundle (4)
Also included in
 This big bundle of printable and digital functions activities can be used for practice, review, group work, partner work, or even as informal assessment in your algebra class. All answer keys are included as well as student answer sheets to make grading easier.You can read more about the resources,Price $36.00Original Price $65.50Save $29.50
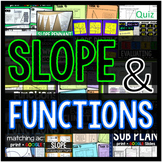 Teaching slope and functions and on the lookout for fun, interactive activity ideas for your students? This bundle includes a bunch of slope and functions activities, as well as a set of Linear Equations Flippables for the slope, slope-intercept and point-slope equations. The activities inside workPrice $50.00Original Price $94.00Save $44.00
Description
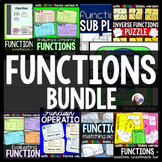
This bundle includes 4 activities covering functions - a sorting activity for functions vs. non-functions, a sorting activity for identifying functions in different forms, a function matching activity for word problems and function task cards. Each is described in more detail below.
All activities in this bundle have been updated with links to interactive GOOGLE versions. The links will be found on the first pages of each activity.
Includes both print + interactive digital versions
You may also like:
Total Pages
25 pages
Answer Key
Included
Teaching Duration
N/A
Report this resource to TPT
Reported resources will be reviewed by our team. Report this resource to let us know if this resource violates TPT’s content guidelines.
Standards
to see state-specific standards (only available in the US).
CCSS8.F.A.1
Understand that a function is a rule that assigns to each input exactly one output. The graph of a function is the set of ordered pairs consisting of an input and the corresponding output.
CCSS8.F.A.2
Compare properties of two functions each represented in a different way (algebraically, graphically, numerically in tables, or by verbal descriptions). For example, given a linear function represented by a table of values and a linear function represented by an algebraic expression, determine which function has the greater rate of change.
CCSS8.F.A.3
Interpret the equation 𝘺 = 𝘮𝘹 + 𝘣 as defining a linear function, whose graph is a straight line; give examples of functions that are not linear. For example, the function 𝘈 = 𝑠² giving the area of a square as a function of its side length is not linear because its graph contains the points (1,1), (2,4) and (3,9), which are not on a straight line.
CCSS8.F.B.5
Describe qualitatively the functional relationship between two quantities by analyzing a graph (e.g., where the function is increasing or decreasing, linear or nonlinear). Sketch a graph that exhibits the qualitative features of a function that has been described verbally.
Reviews
Questions & Answers
30.4k Followers
