
Graphing Exponential Functions Shamrocks for St. Patrick's Day


- PDF
Also included in
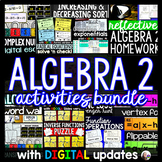 This algebra 2 activities bundle includes all of the current printable and digital algebra 2 activities in my store, along with all future additions. All updates to the bundle are free.Topics covered:Exponentials, inverses, complex numbers, domain and range, increasing and decreasing, logarithms, rPrice $60.00Original Price $155.00Save $95.00
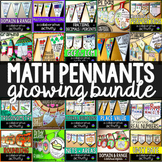 This big bundle of math pennants includes every math pennant (100+) for elementary, middle and high school math. Students of all ages love seeing their math displayed! It builds confidence and is a reminder on those tougher days that we are all math people. Don't need every math pennant? I also havePrice $75.00Original Price $394.50Save $319.50
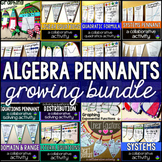 This bundle currently includes 38 algebra pennants and will be updated with additional sets when they are created. You will be notified when a new set is added and will be able to re-download to get the new sets free of charge. Math pennants are a fun way to show off student work, create colorful buPrice $50.00Original Price $116.50Save $66.50
Description
Students graph exponential functions in this math pennant activity that doubles as student-created classroom décor. Each pennant is shaped like a shamrock to celebrate St. Patrick's Day in your algebra classroom.
*This is the same activity as Valentine's Day Algebra Graphing Exponential Functions Hearts Math Pennant, only with a St. Patrick's Day theme.
All exponential functions are growth functions and the problems vary in difficulty, from functions with only vertical shifts to functions with vertical and horizontal shifts. Each pennant includes a table for students to fill in to find points to plot. The coordinates in the answer key are based on coordinates found after shifting parent graphs. You can find a free graphing exponential functions cheat sheet to go along with this activity here:
This activity includes 20 shamrock pennants that vary in difficulty and an answer key with graphs and completed tables.
See all holiday math activities.
You may also like:
