Graphing Linear Equations Project | Real World Functions PBL Activity | Algebra
- Zip
What educators are saying
Also included in
- Are your students struggling to grasp the concepts of linear functions? Look no further than this Linear Equations Mini-Bundle – review activities for writing linear equations in slope-intercept form, graphing linear functions from tables, and more! Make the learning process more enjoyable while ensPrice $11.50Original Price $19.25Save $7.75
- This bundle is a great addition to any Algebra curriculum! Includes many algebra concepts – one-step, two-step, multi-step, and absolute value equations and inequalities, linear equations, systems of equations, exponential functions, exponents, quadratics, and more! A diverse set of resources – selfPrice $130.00Original Price $226.50Save $96.50
Description
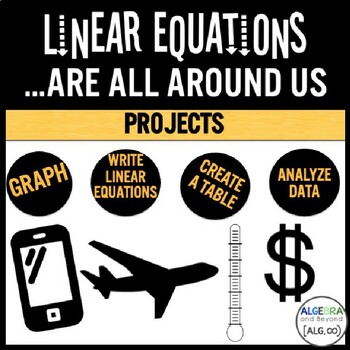
Connect algebra to real life in this Graphing Linear Equations Project. This project based learning activity is perfect for students to write a linear equation, graph the function, and analyze characteristics of the graph. Plus, they have fun discovering that linear equations are all around us! This resource includes SIX different projects (100% editable) from basic to advanced levels of Pre-Algebra and Algebra.
The real-life topics:
• Cell phone plans
• Hourly Wages
• Frequent Flyer Miles
• Temperature Conversions
• Taxi Fares
• Car Depreciation (linear)
OBJECTIVE: Analyze a linear equation in a real world setting. Students will be able to demonstrate your knowledge and understanding of the following skills:
- Write a linear equation that represents a real world scenario.
- Create a table to represent data for the linear equation.
- Graph the linear equation.
- Create a visual demonstrating this real world scenario.
- Answer questions about the real world scenario by analyzing the equation, table, and graph.
INCLUDED (EDITABLE):
- 6 Student Projects – Print (PPT & PDF) & Digital (Google Slides)
- Answer Keys (Google Sheets)
- Rubric (PPT)
- Example Project (Google Slides)
Check out the PREVIEW to see what skills are covered and more details of this fun project!!!
✅ Click HERE to SAVE over 30% on the Linear Equations Activities Mini-Bundle
You can find more Real World Projects here:
Real World Quadratic Equations Project
Systems of Linear Equations Project
Linear, Exponential, & Quadratic Regression Project
Exponential Regression Project | Cryptocurrency
Solving Absolute Value Inequalities Project
Real World Quadratic Regression Project
Math Review Project | Math Vlogger
∞∞∞∞∞∞∞∞∞∞∞∞∞∞∞∞∞∞∞∞∞∞∞∞∞∞∞∞∞∞∞∞∞∞∞∞∞∞∞∞∞∞∞∞∞∞∞
© Algebra and Beyond
This product is intended for personal use in one classroom only. For use in multiple classrooms, please purchase additional licenses.


