TPT
Total:
$0.00

Graphing Linear Inequalities Algebra 1 Matching Activity

Rated 4.85 out of 5, based on 146 reviews
4.9 (146 ratings)
;
Scaffolded Math and Science
30.4k Followers
Grade Levels
8th - 9th
Subjects
Resource Type
Standards
Formats Included
  • PDF
  • Google Appsâ„¢
Pages
12 pages
$3.00
$3.00
Share this resource
Report this resource to TPT
Scaffolded Math and Science
30.4k Followers
Includes Google Appsâ„¢
The Teacher-Author indicated this resource includes assets from Google Workspace (e.g. docs, slides, etc.).

What educators are saying

My students loved this activity. It really helped those who were struggling. I had them separate the inequalities and graphs into two piles--including the line and not including the line and work on each pile separately. Perfect. Thank you!
I taught our unit on systems of equations with lots of activities - including this one. This was a great activity for my students - they loved that it was something different and it got them discussing with each other.

Description

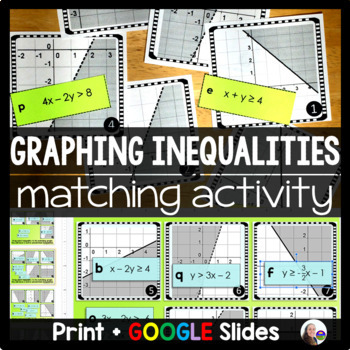
Students match 18 graphs to their correct 2-variable inequalities in this hands-on, low-prep algebra 1 activity. Inequalities are written in both standard form and slope-intercept form. This activity works great as a review or as a way to check for class understanding of the way that we graph inequalities.

This activity includes a link to a drag-and-drop digital version in Google Slides where students sort the digital inequality slips onto their correct graphs. In the digital version, there will be 2 unmatched inequality slips on each slide. You can delete these distractor answers before assigning the activity to make it less challenging. The printable version does not include distractor answers.

Included in: Algebra Activities Bundle

You may also like:

Graphing Linear Equations Digital Math Escape Room

Algebra Word Wall

Total Pages
12 pages
Answer Key
Included
Teaching Duration
N/A
Report this resource to TPT
Reported resources will be reviewed by our team. Report this resource to let us know if this resource violates TPT’s content guidelines.

Standards

to see state-specific standards (only available in the US).
Represent constraints by equations or inequalities, and by systems of equations and/or inequalities, and interpret solutions as viable or non-viable options in a modeling context. For example, represent inequalities describing nutritional and cost constraints on combinations of different foods.
Graph the solutions to a linear inequality in two variables as a half-plane (excluding the boundary in the case of a strict inequality), and graph the solution set to a system of linear inequalities in two variables as the intersection of the corresponding half-planes.

Reviews

Questions & Answers