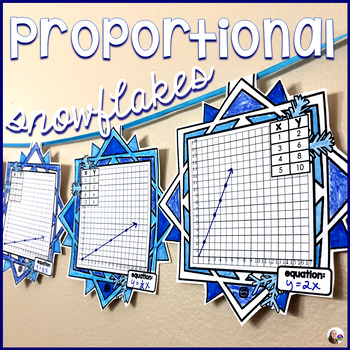
Graphing Proportional Relationships Snowflake Winter Math Pennant Activity
- PDF
What educators are saying
Also included in
- This big bundle of math pennants includes every math pennant (100+) for elementary, middle and high school math. Students of all ages love seeing their math displayed! It builds confidence and is a reminder on those tougher days that we are all math people. Don't need every math pennant? I also havePrice $75.00Original Price $394.50Save $319.50
Description
Students plot coordinates of proportional relationships then find their equations in this winter math activity that doubles as classroom décor. The given coordinates in the tables do not always start with (0, 0) and also are not always consecutive. For example, a table may give the coordinates (1, 2), (3, 6), (4, 8), (5, 10), skipping (2, 4). After plotting, students are asked to determine their graph's equation.
Included in this snowflake activity are 30 pennants. Also includes 2 extra pennants without table values for you to create your own tables for students to plot.
There are 2 versions of an optional student answer sheet included: a 1-page answer sheet where students only record the equations and a 3-page answer sheet where students plot each set of table values and also record the equations. Answer keys for both answer sheets are included. You can see page 3 of the longer answer key in the thumbnails.
*For a set of snowflakes for older kids, please see Plotting Coordinate Points Snowflake Pennant.
Each pennant is in the shape of a snowflake. Once a pennant is complete, it can be hung along a string in your classroom to show the world that, "Hey, we know how to plot coordinates from proportional tables!"
Each group of students can be given a set of pennants, scissors and either glue, tape or a stapler. Students can be in charge of cutting out the pennants. Groups can compete to see which group can complete the most pennants or your entire class can add pennants to one string as they complete each one as a way to celebrate winter holidays and Christmas. You may also choose to have your students color their pennants to add to your classroom décor.
See all holiday math activities.
You may also like:
Additive & Proportional Relationships Digital Math Escape Room


