


Scaffolded Math and Science
30.4k Followers
Resource Type
Standards
CCSSHSF-IF.C.7
Formats Included
- PDF
Pages
2 pages
Scaffolded Math and Science
30.4k Followers
Also included in
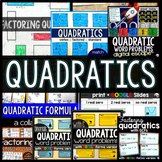 This big bundle of printable and digital quadratic activities allows you to easily differentiate your quadratic functions unit. The bundle includes:"2 Truths and a Lie" Key Features of Quadratic Graphs Error Analysis ActivityDigital Algebra Tiles - Factoring QuadraticsDiscriminant Sorting Activity fPrice $36.00Original Price $62.00Save $26.00
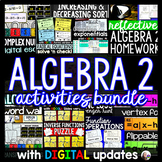 This algebra 2 activities bundle includes all of the current printable and digital algebra 2 activities in my store, along with all future additions. All updates to the bundle are free.Topics covered:Exponentials, inverses, complex numbers, domain and range, increasing and decreasing, logarithms, rPrice $60.00Original Price $155.00Save $95.00
Description
This reference sheet for graphing quadratics in standard form walks students through using the axis of symmetry formula to find the vertex and then finding coordinates on each side of the vertex to sketch in the parabola.
Included in the file is a link to a video that walks students through the steps outlined on the sheet for a different quadratic. This way students can cross-reference what they learn in the video with what is printed on their reference sheet and then apply to their own graphing quadratics problems. *Includes link to YouTube video tutorial.
You may also like:
Quadratic Word Problems Tasks (TRINOMIALS) - print and digital
Total Pages
2 pages
Answer Key
N/A
Teaching Duration
N/A
Report this resource to TPT
Reported resources will be reviewed by our team. Report this resource to let us know if this resource violates TPT’s content guidelines.
Standards
to see state-specific standards (only available in the US).
CCSSHSF-IF.C.7
Graph functions expressed symbolically and show key features of the graph, by hand in simple cases and using technology for more complicated cases.
Reviews
Questions & Answers
30.4k Followers
