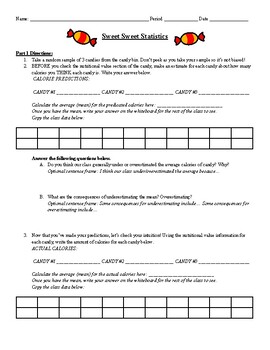
Halloween / Fall Statistics Class Activity for Box Plots and Five Number Summary
Math with Ms Li
6 Followers
Grade Levels
9th - 12th, Higher Education
Subjects
Resource Type
Standards
CCSSHSS-ID.A.1
CCSSHSS-ID.A.2
CCSSHSS-ID.A.3
CCSSHSS-ID.A.4
Formats Included
- PDF
Pages
2 pages
Math with Ms Li
6 Followers
Description
Hello!
If you're looking for a fun and engaging activity for your Statistics Class this Halloween or fall season, this activity is great! My students enjoy getting the opportunity to eat candy as they work on some real-world statistical applications. The activity requires students to collect data, share data with their peers, and analyze the data. They will be working on creating a five number summary and analyzing/drawing box plots. You will need to purchase candy for this activity. Please reach out if you have any questions!
Total Pages
2 pages
Answer Key
N/A
Teaching Duration
90 minutes
Report this resource to TPT
Reported resources will be reviewed by our team. Report this resource to let us know if this resource violates TPT’s content guidelines.
Standards
to see state-specific standards (only available in the US).
CCSSHSS-ID.A.1
Represent data with plots on the real number line (dot plots, histograms, and box plots).
CCSSHSS-ID.A.2
Use statistics appropriate to the shape of the data distribution to compare center (median, mean) and spread (interquartile range, standard deviation) of two or more different data sets.
CCSSHSS-ID.A.3
Interpret differences in shape, center, and spread in the context of the data sets, accounting for possible effects of extreme data points (outliers).
CCSSHSS-ID.A.4
Use the mean and standard deviation of a data set to fit it to a normal distribution and to estimate population percentages. Recognize that there are data sets for which such a procedure is not appropriate. Use calculators, spreadsheets, and tables to estimate areas under the normal curve.


