TPT
Total:
$0.00

Increasing and Decreasing Functions Matching Activity - print and digital

Rated 4.77 out of 5, based on 155 reviews
4.8 (155 ratings)
;
Scaffolded Math and Science
30.4k Followers
Grade Levels
9th - 11th
Resource Type
Standards
Formats Included
  • PDF
  • Google Appsâ„¢
Pages
10 pages
$3.00
$3.00
Share this resource
Report this resource to TPT
Scaffolded Math and Science
30.4k Followers
Includes Google Appsâ„¢
The Teacher-Author indicated this resource includes assets from Google Workspace (e.g. docs, slides, etc.).

What educators are saying

Any time students can see and sort a new topic, it is very helpful for them. this one provided a quick and easy review for them to make sure they understood the topic.
Also included in
  1. This algebra 2 activities bundle includes all of the current printable and digital algebra 2 activities in my store, along with all future additions. All updates to the bundle are free.Topics covered:Exponentials, inverses, complex numbers, domain and range, increasing and decreasing, logarithms, r
    Price $60.00Original Price $155.00Save $95.00

Description

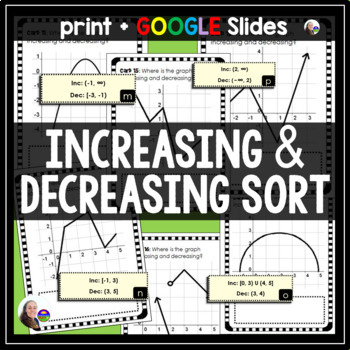
Students match graphs to their increasing and decreasing intervals in this activity. There are 20 graphs that each both increase and decrease and 20 interval cutouts that students sort onto their correct graphs. Some intervals include infinity, others are only integers, and some are a combination of both.

This download includes both a printable and digital version of the activity. The digital version is on GOOGLE Slides. There are 4 cards and 6 domain/range slips per slide. Once all slips are matched with their cards, there will be 2 slips left over.

Included is a student answer sheet to ease grading and an answer key. Includes both print + interactive digital versions

Included in: Algebra Activities Bundle

You may also like:

Function Composition Digital Math Escape Room

Domain and Range Sorting Activity

Inverse Functions Digital Math Escape Room

Algebra 2 Word Wall

Total Pages
10 pages
Answer Key
Included
Teaching Duration
N/A
Report this resource to TPT
Reported resources will be reviewed by our team. Report this resource to let us know if this resource violates TPT’s content guidelines.

Standards

to see state-specific standards (only available in the US).
Describe qualitatively the functional relationship between two quantities by analyzing a graph (e.g., where the function is increasing or decreasing, linear or nonlinear). Sketch a graph that exhibits the qualitative features of a function that has been described verbally.
For a function that models a relationship between two quantities, interpret key features of graphs and tables in terms of the quantities, and sketch graphs showing key features given a verbal description of the relationship.

Reviews

Questions & Answers