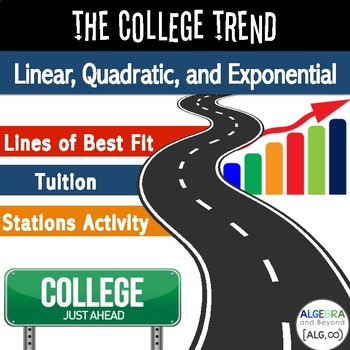
Linear, Exponential, & Quadratic Functions Regression Project | Scatter Plot PBL
- Zip
What educators are saying
Also included in
- This bundle is a great addition to any Algebra curriculum! Includes many algebra concepts – one-step, two-step, multi-step, and absolute value equations and inequalities, linear equations, systems of equations, exponential functions, exponents, quadratics, and more! A diverse set of resources – selfPrice $130.00Original Price $226.50Save $96.50
- This bundle is a great addition to any Algebra 2 curriculum! Includes many algebra 2 concepts – imaginary numbers, quadratic functions, piecewise functions, polynomials, radicals, exponentials, rational functions, and more! A diverse set of resources – games, projects, practice worksheets, and more!Price $75.00Original Price $121.50Save $46.50
Description
Connect algebra to real life in this Graphing Linear, Exponential and Quadratic Functions Regression Project. This project based learning activity is perfect for students to write a linear, quadratic, or exponential equation, graph the scatter plot and function, and analyze the data.
Students collect and analyze college tuition data to determine the linear, quadratic and/or exponential curve of best fit (regression), and predict future tuition costs.
College Trend Project - Students will be able to demonstrate their knowledge and understanding of the following skills:
• Gather accurate data and create a table
• Graph a scatter plot
• Find the linear, quadratic, and exponential line/curve of best fit and graph
• Determine which equation best models the data using the coefficient of determination
• Predict future tuition costs using the line/curve of best fit function
• Research background information about each university/college
This project is 100% editable, including the rubric!
BONUS Calculator Reference Sheets included:
Regression: Coefficient of Determination
Check out the preview to see what skills are covered and more details of this fun project!!!
∞∞∞∞∞∞∞∞∞∞∞∞∞∞∞∞∞∞∞∞∞∞∞∞∞∞∞∞∞∞∞∞∞∞∞∞∞∞∞∞∞∞∞∞∞∞∞
© Algebra and Beyond
This product is intended for personal use in one classroom only. For use in multiple classrooms, please purchase additional licenses.


