Plotting and Finding Slope from a Table Snowflake Winter Math Pennant Activity
- PDF
What educators are saying
Also included in
- This big bundle of math pennants includes every math pennant (100+) for elementary, middle and high school math. Students of all ages love seeing their math displayed! It builds confidence and is a reminder on those tougher days that we are all math people. Don't need every math pennant? I also havePrice $75.00Original Price $394.50Save $319.50
- This bundle currently includes 38 algebra pennants and will be updated with additional sets when they are created. You will be notified when a new set is added and will be able to re-download to get the new sets free of charge. Math pennants are a fun way to show off student work, create colorful buPrice $50.00Original Price $116.50Save $66.50
- This bundle contains 29 selected middle school math pennants. “This was one of the things that many of my students commented that they enjoyed when I asked them at the end of the year. They liked the opportunity to be somewhat creative. I think they felt like they were less threatening than "real" wPrice $40.00Original Price $85.00Save $45.00
Description
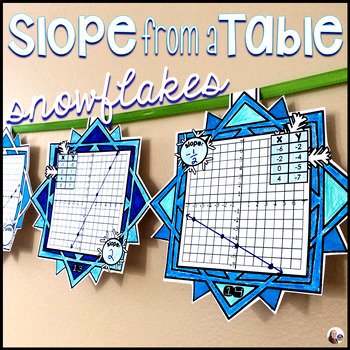
Students plot points from tables and then find slope in this winter math pennant activity that doubles as classroom décor. All tables represent linear functions. After plotting the coordinate points, students are asked to determine the slope.
Included in this snowflake activity are 30 pennants. Also includes 2 extra pennants without table values for you to create your own tables for students to plot. There are 2 versions of an optional student answer sheet included: a 1-page answer sheet where students only record slope and a 3-page answer sheet where students plot each set of table values and also record slope. Answer keys for both answer sheets are included. You can see page 3 of the longer answer key in the thumbnails.
*For a similar set for proportional relationships, please see Proportional Relationships Snowflake Pennant.
Each group of students can be given a set of pennants, scissors and either glue, tape or a stapler. Students can be in charge of cutting out the pennants. Groups can compete to see which group can complete the most pennants or your entire class can add pennants to one string as they complete each one as a way to celebrate winter holidays and Christmas. You may also choose to have your students color their pennants to add to your classroom décor.
See all holiday math activities.
You may also like:
Coordinate Plane Digital Math Escape Room
8th Grade Math Word Wall - print and digital


