TPT
Total:
$0.00

Rate of Change (Slope) Solve 'n Check! Math Tasks - print and digital

Rated 4.89 out of 5, based on 117 reviews
4.9 (117 ratings)
;
Scaffolded Math and Science
30.4k Followers
Grade Levels
8th - 9th
Subjects
Resource Type
Standards
Formats Included
  • PDF
  • Google Apps™
Pages
12 pages
$3.00
$3.00
Share this resource
Report this resource to TPT
Scaffolded Math and Science
30.4k Followers
Includes Google Apps™
The Teacher-Author indicated this resource includes assets from Google Workspace (e.g. docs, slides, etc.).

What educators are saying

I like that both print and Google drive options are included. This is great because I can use the print version for small group instruction and the other students can work on the Google drive version for independent practice!
My students loved using the task cards. I loved the fact that they could check their answers on their own.
Also included in
  1. This bundle contains print and digital middle school math activities. Each activity inside comes in both forms. The digital versions are linked within the printable files and were built in either Google Slides or Google Forms, depending on which made sense for the activity. The Google Forms can be d
    Price $44.00Original Price $66.50Save $22.50

Description

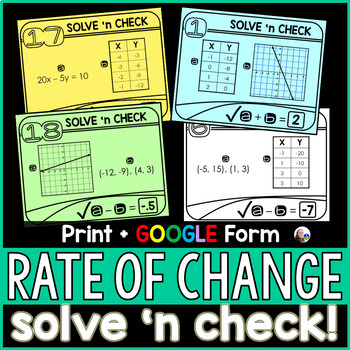
On each card, students first determine the slope shown in 2 representations (table, graph, set of ordered pairs, equation*). Next, they either add, subtract, multiply or divide these slope values (based on what their card says to do) to see if the result matches the check number in the lower right corner of the card. Chances are if the check number matches, the rates of change were found correctly!

This activity is self-checking, giving students that instant feedback they love.

The printable version Includes 20 task cards that print 4 per page. The cards vary in difficulty so that all students can work at their own level. *Cards 11-20 include equations in standard form, whereas cards 1-10 only include graphs, tables and ordered pairs. Two versions of the paper answer sheet are included: one with spaces to answer all 20 cards and one with spaces to answer 10 cards, if you'd like a shorter activity.

The digital version is in Google Forms. There are 2 versions included: one version includes all 20 cards. The second version includes just 10 cards, if you'd like students to have a shorter activity. Includes both print + interactive digital versions

You may also like:

Graphing Linear Equations Digital Math Escape Room

Comparing Functions Partner Scavenger Hunt

8th Grade Math Word Wall - print and digital

Total Pages
12 pages
Answer Key
Included
Teaching Duration
N/A
Report this resource to TPT
Reported resources will be reviewed by our team. Report this resource to let us know if this resource violates TPT’s content guidelines.

Standards

to see state-specific standards (only available in the US).
Compare properties of two functions each represented in a different way (algebraically, graphically, numerically in tables, or by verbal descriptions). For example, given a linear function represented by a table of values and a linear function represented by an algebraic expression, determine which function has the greater rate of change.
Construct a function to model a linear relationship between two quantities. Determine the rate of change and initial value of the function from a description of a relationship or from two (𝘹, 𝘺) values, including reading these from a table or from a graph. Interpret the rate of change and initial value of a linear function in terms of the situation it models, and in terms of its graph or a table of values.

Reviews

Questions & Answers