Real-Life Statistics Project
Mr Stadalman
443 Followers
Grade Levels
4th - 8th, Homeschool
Subjects
Resource Type
Formats Included
- PDF
Pages
2 pages
Mr Stadalman
443 Followers
Description
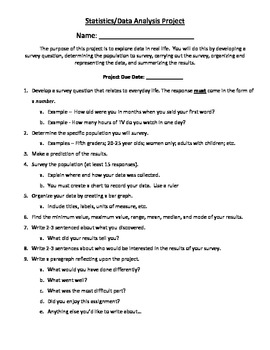
Students must think of a survey question that can be answered numerically. Then, they must go out into their community or school and ask at least 15 people their question. After collecting their data, they must find the minimum, maximum, range, mean, median, and mode. Also, they must graph their results, and answer a few reflection questions about their data.
I have my kids put all of this information on a poster or make a powerpoint presentation to show the class. I find this activity really makes the concepts of mean, median, mode, minimum, maximum, and range more realistic for the students and thus easier to understand.
I attached a sample project a student completed for me. Not necessarily the best example, but gives you at least something to know what a final project could look like.
Included in the downloaded file is the overview sheet I give to students and a rubric to grade them with.
Total Pages
2 pages
Answer Key
N/A
Teaching Duration
N/A
Report this resource to TPT
Reported resources will be reviewed by our team. Report this resource to let us know if this resource violates TPT’s content guidelines.


