Scatter Plot Worksheet with Graphing Calculator Practice
Rise over Run
24k Followers
Grade Levels
8th - 9th
Subjects
Resource Type
Standards
CCSSHSS-ID.B.6
CCSSHSS-ID.B.6a
CCSSHSS-ID.B.6b
CCSSHSS-ID.B.6c
CCSSHSS-ID.C.7
Formats Included
- PDF
- Easel Activity
Pages
1 Student Sheet + Answer Key
Rise over Run
24k Followers
Easel Activity Included
This resource includes a ready-to-use interactive activity students can complete on any device. Easel by TPT is free to use! Learn more.
What educators are saying
My students loved getting to use the "fancy calculators" to work on this. I used this as an introduction of regression and I think it was a great, low stakes intro!
Also included in
- Do you love discovery learning, collaboration, hands-on activities, and projects that help students make sense of the math they are learning? This curriculum is packed with engaging and challenging Algebra I and 8th grade math resources for the whole year. A variety of activities, inquiry learningPrice $350.00Original Price $677.94Save $327.94
- This curriculum bundle includes a variety of activities, assessments, games, group activities, projects, inquiry lessons, guided notes, and more for teaching Algebra I CCSS standards. The activities are centered on discovery learning and engaging activities with real world connections. Lessons helpPrice $225.00Original Price $445.21Save $220.21
- Engage students in learning about scatter plots with this bundle of activities! The activities and lessons include real world examples to help students see the relevance and importance of scatter plots!Included:Scatter Plot Experiment ActivityScatter Plot Practice Sheets (Six Worksheets)Math MeetsPrice $14.00Original Price $20.99Save $6.99
Description
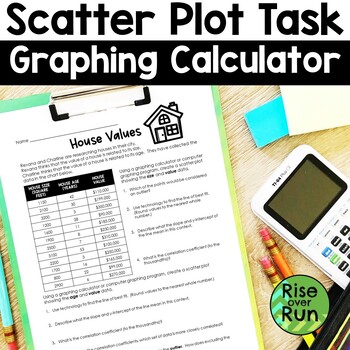
Need a real world scatter plot activity where students use their graphing calculators? Grab this activity and help your students understand lines of best fit and calculating correlation coefficients!
Students are given data on house sizes, house ages, and house values.
They use a graphing calculator or computer program to plot the points and answer questions that follow.
This is a great activity for partners to explore or for individual work. It can lead to some great math discussions!
Answer key is included.
You might also like my scatter plot bundle!
Total Pages
1 Student Sheet + Answer Key
Answer Key
Included
Teaching Duration
45 minutes
Report this resource to TPT
Reported resources will be reviewed by our team. Report this resource to let us know if this resource violates TPT’s content guidelines.
Standards
to see state-specific standards (only available in the US).
CCSSHSS-ID.B.6
Represent data on two quantitative variables on a scatter plot, and describe how the variables are related.
CCSSHSS-ID.B.6a
Fit a function to the data; use functions fitted to data to solve problems in the context of the data.
CCSSHSS-ID.B.6b
Informally assess the fit of a function by plotting and analyzing residuals.
CCSSHSS-ID.B.6c
Fit a linear function for a scatter plot that suggests a linear association.
CCSSHSS-ID.C.7
Interpret the slope (rate of change) and the intercept (constant term) of a linear model in the context of the data.


