Angie Kerr
34 Followers
Grade Levels
7th - 9th
Subjects
Resource Type
Standards
CCSSHSS-ID.B.6
Formats Included
- NOTEBOOK (SMARTboard) File
Pages
18 pages
Angie Kerr
34 Followers
Description
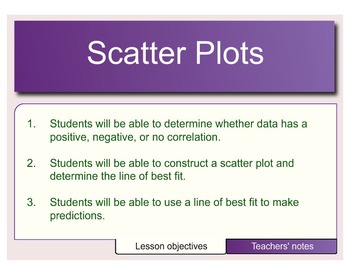
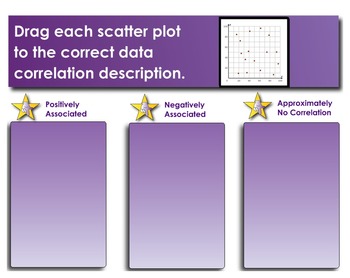
This lesson explores creating and analyzing scatter plots by determining the correlation: positive, negative, or no correlation. It also incorporates making predictions based on the line of best fit.
Negative Correlation, Data Display, Scatter Plot, Positive Correlation, Line of Best Fit, Best Fit Line, Correlation, No Correlation, Independent Variable, Dependent Variable
Negative Correlation, Data Display, Scatter Plot, Positive Correlation, Line of Best Fit, Best Fit Line, Correlation, No Correlation, Independent Variable, Dependent Variable
Total Pages
18 pages
Answer Key
N/A
Teaching Duration
40 minutes
Report this resource to TPT
Reported resources will be reviewed by our team. Report this resource to let us know if this resource violates TPT’s content guidelines.
Standards
to see state-specific standards (only available in the US).
CCSSHSS-ID.B.6
Represent data on two quantitative variables on a scatter plot, and describe how the variables are related.


