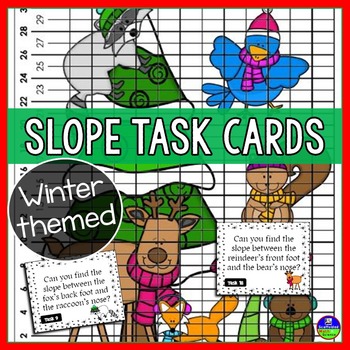
Slope Task Cards with a Winter Theme
Scaffolded Math and Science
30.4k Followers
Resource Type
Standards
CCSS8.F.A.2
CCSS8.F.B.4
Formats Included
- PDF
Pages
12 pages
Scaffolded Math and Science
30.4k Followers
Also included in
- Teaching slope and functions and on the lookout for fun, interactive activity ideas for your students? This bundle includes a bunch of slope and functions activities, as well as a set of Linear Equations Flippables for the slope, slope-intercept and point-slope equations. The activities inside workPrice $50.00Original Price $94.00Save $44.00
Description
Students practice finding slope between two points in this winter-themed task card activity. Students are given a winter graph and are asked to find the slope between parts of two winter animals, such as "Find the slope between the tip of the fox's tail and the squirrel's nose." Some cards ask students to find the slope between two dates, such as "Find the slope between January 1 and June 23." The download includes 20 task cards, a winter graph, a student answer sheet and a teacher answer key. This activity is meant to capture and hold student attention around the holidays.
See all holiday math activities.
You may also like:
Total Pages
12 pages
Answer Key
Included
Teaching Duration
N/A
Report this resource to TPT
Reported resources will be reviewed by our team. Report this resource to let us know if this resource violates TPT’s content guidelines.
Standards
to see state-specific standards (only available in the US).
CCSS8.F.A.2
Compare properties of two functions each represented in a different way (algebraically, graphically, numerically in tables, or by verbal descriptions). For example, given a linear function represented by a table of values and a linear function represented by an algebraic expression, determine which function has the greater rate of change.
CCSS8.F.B.4
Construct a function to model a linear relationship between two quantities. Determine the rate of change and initial value of the function from a description of a relationship or from two (𝘹, 𝘺) values, including reading these from a table or from a graph. Interpret the rate of change and initial value of a linear function in terms of the situation it models, and in terms of its graph or a table of values.


