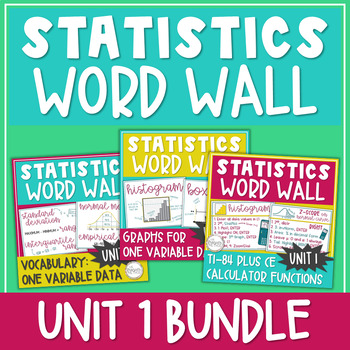
Statistics Word Wall / Statistics Posters / Math Bulletin Board Graphs & Charts
- Zip
What educators are saying
Products in this Bundle (3)
Description
43 PAGES of Statistics Posters to add high school math classroom décor to your math bulletin board, math word wall, hallway, door, or as anchor charts with these 8.5" by 11" Statistics Word Wall Posters filled with STATISTICS GRAPHS, VOCABULARY, & TI-84 PLUS CE CALCULATOR FUNCTIONS! Definitions, formulas, graph features, and step-by-step calculator directions!
Everything included in this bundle is from Unit 1: Exploring One-Variable Data in AP Statistics, and the information on each slide aligns with AP College Board's objectives and standards for AP Statistics.
WHAT’S INCLUDED IN THIS PRODUCT?
Statistics Word Wall – Vocabulary & Formulas Unit 1
Statistics Word Wall – Graphs, Tables, Chart, & Plots Unit 1
Statistics Word Wall – TI-84 Plus CE Calculator Functions Unit 1
ALL PAGES ARE IN COLOR & GRAYSCALE.
43 Total Pages
Size: 8.5 by 11 inches
[If you don't have colored ink, you can print the grayscale pages in black ink on colored paper!]
Decorate your...
*CLASSROOM BULLETIN BOARD
*HALLWAY BULLETIN BOARD
*MATH WORD WALL
...or provide to your students to help them review for the AP Statistics Exam!
UNIT 1 – VOCABULARY & FORMULAS:
16 PAGES
- "Statistics Word Wall" Title Page
- Categorical Variable, Quantitative Variable
- Frequency, Relative Frequency
- Percentiles, Quartiles
- Sample, Statistic, Population, Parameter
- Summary Statistics, 5-Number Summary
- Lower Fence, Upper Fence
- Describe the Distribution, CUSS: Center, Unusual Features, Shape, & Spread
- Mean, Median
- Outlier, Gap, Cluster
- Symmetric, Skewed Left, Skewed Right
- Unimodal, Bimodal, Uniform
- Standard Deviation, Range, Interquartile Range Definitions
- Standard Deviation, Range, Interquartile Range Formulas
- Normal Model, Empirical Rule
- Z-Score
UNIT 1 – GRAPHS, PLOTS, TABLES, & CHARTS:
10 PAGES
- "Statistics Word Wall" Title Page
- Frequency Table
- Relative Frequency Table
- Bar Chart
- Pie Chart
- Dot Plot
- Stem-and-Leaf Plot
- Histogram
- Cumulative Relative Frequency Plot
- Box Plot
- Additional Information throughout the 10 Pages in this Word Wall:
- Features of Each Type of Graph / How to Read Each Type of Graph
- Shape of a Distribution - Symmetric, Skewed, Unimodal, Bimodal
- Unusual Features of a Distribution - Outliers, Gaps, Clusters
- Categorical or Quantitative Variable
- Frequency or Relative Frequency
UNIT 1 – TI-84 PLUS CE CALCULATOR FUNCTIONS:
17 PAGES
- "Calculator Functions TI-84 Plus CE" Title Page
- "AP Statistics Calculator Functions TI-84 Plus CE" Title Page
- "Statistics Calculator Functions TI-84 Plus CE" Title Page
- "Unit 1: Exploring One-Variable Data" Title Page
- Enter Data Values in a List
- Clear a List of Data Values
- Histogram
- Change a Histogram’s Bin Width
- Boxplot
- 5-Number Summary: Minimum, Q1, Median, Q3, Maximum
- Center & Spread: Mean & Standard Deviation
- Area % under Normal Model – Left
- Area % under Normal Model – Right
- Area % under Normal Model – Center
- Z-Score on a Normal Model – Left
- Z-Score on a Normal Model – Right
- Z-Score on a Normal Model – Center
TERMS OF USE included for posting on online teaching sites like Blackboard or Moodle.
YOU MAY ALSO LIKE:
Statistics Word Wall – Vocabulary & Graphs Unit 2
AP Statistics TI-84 Calculator Functions for the ENTIRE YEAR
AP Statistics Formulas & Vocabulary for the ENTIRE YEAR
AP Statistics Notes – Unit 1 Bundle
AP Statistics Notes – Unit 3 Bundle
AP Statistics Notes WITH VIDEOS – Unit 3 Bundle
SAVE MONEY ON TPT:
Earn TPT credit by reviewing products you buy! Go to "My Purchases" and click “Provide Feedback” next to each product to leave a review. These points add up and can go towards your future purchases! YAY!!!
Thank you for considering my product for purchase!


