Stock Market Math Project | Build Personal Financial Literacy
- Zip
What educators are saying
Description
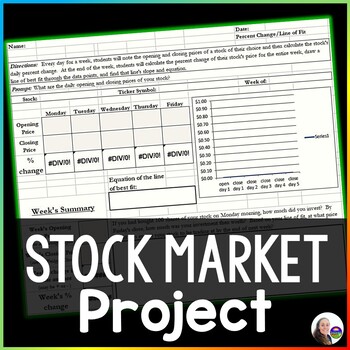
This stock market project asks students to follow a stock of their choice for a week, calculate the daily and weekly percent change in price, estimate a line of fit for their scatter plot, find the slope and equation of their line of fit and write a final analysis of their data. The project is editable so you can customize as you need to for your students. Also now includes a link to a Google Sheet version for online learning.
The final spreadsheet is formatted with formulas that automatically calculate percent changes. All files are editable so that you can change the project as needed.
Also includes:
Detailed student directions and rough draft of final project
Excel file with programmed equations that calculate percent change
Excel cell directions
Grading rubric
Extra graph cutouts
Link to Google Sheet version for online learning
Includes both print + interactive digital versions
You may also like:
Stock Market Task Cards - percent change - print and digital


