
Theoretical vs. Experimental Probability Anchor Chart Poster


- PDF
Also included in
 This Bundle of sixth grade math reference sheets are designed and aligned with 6th grade math! Fractions, Decimals, Ratios, Proportions, Expressions, Equations, Combining like terms, and more! Pretty much everything students need to know and understand for 6th grade. They make for excellent scaffolPrice $82.20Original Price $102.75Save $20.55
Description
This probability and statistics anchor chart is compares experimental and theoretical probability for middle school math students. Students will be able to see the difference between different probabilities and use this as a scaffold and reference when working with probability. It is a great tool to display in your classroom and/or distribute to your students to place in their interactive notebooks or binder. This anchor chart is aligned with the 7th grade Probability and Statistics Common Core standards.
***********************************************************************************************
HOW TO USE:
This anchor chart can be printed on a regular 8.5 x 11 inch printing paper and placed in student notebooks, or printed as a half-page making an excellent resource for students interactive notebook.
You can also scale the PDF file and print it on poster size paper and display it within your classroom. That is how I use my anchor charts.
***********************************************************************************************
WHATS INCLUDED:
★ Definition of Theoretical Probability
★ Definition of Experimental Probability
★ Example of Theoretical Probability
★ Example of Experimental Probability
OTHER ANCHOR CHARTS YOU MAY ALSO LIKE:
Included in this product:
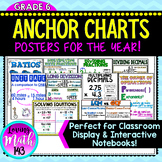
★ The Order of Operations Anchor Chart
★ Combining Like Terms Anchor Chart
★ Factor IN and Factor OUT anchor chart
★ Ratio, Ratio Table, and Unit Rate Anchor Chart
★ Dividing Fractions and Mixed Numbers Anchor Chart Poster
★ Multiplying Fractions Anchor Chart
★ Volume of a Rectangular Prism Anchor chart
★ Absolute Value Anchor Chart Poster
★ Least Common Multiple vs. Greatest Common Factor Anchor Chart
★ Keywords for Graphing Inequalities on Number Line Anchor Chart Poster
★ Mean, Median, Mode, Range Anchor Chart Poster
***********************************************************************************************
LICENSING TERMS: This purchase includes a license for one teacher only for personal use in their classroom. Licenses are non-transferable, meaning they can not be passed from one teacher to another. No part of this resource is to be shared with colleagues or used by an entire grade level, school, or district without purchasing the proper number of licenses.
COPYRIGHT TERMS: This resource may not be uploaded to the internet in any form, including classroom/personal websites or network drives, unless the site is password protected and can only be accessed by students.
