101 results
10th grade Common Core 6.SP.A.2 resources
Analyzing Plots, Graphs, and Tables using Measures of Central Tendency
This product provides students the opportunity to analyze data presented in different ways. By making calculations and analyzing data, students make conjectures and justify them using mathematical reasoning and evidence!What is included?This product contains 8 student work pages. Each work page contains a set of data displayed graphically with accompanying questions. The data displays included are 2 dot plots, 2 bar graphs, 2 frequency tables, and 2 stem-and-leaf plots. Students are required
Subjects:
Grades:
5th - 11th
Types:
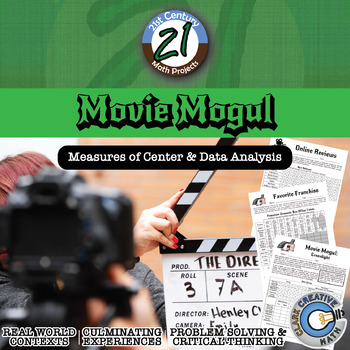
Movie Mogul - Mean, Median & Variation - Project - Distance Learning Compatible
Nowadays online reviews have a huge impact on business. Customer ratings help people decide what to buy and what products to avoid. Movies and entertainment are moving toward the world of intense data analysis of audience views to make business decisions. Companies like Amazon and Netflix have poured resources into developing original content. Let your students sit in the driver's seat! -- and practice Mean, Median and Variation in this 21st Century Math Project!In this 22 page document you will
Subjects:
Grades:
6th - 12th
Types:
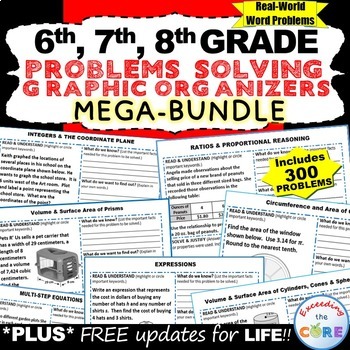
6th, 7th, 8th Grade Math PROBLEM SOLVING GRAPHIC ORGANIZER BUNDLE : end of year
This middle school math BUNDLE includes 35 sets (350 problems) of 6th, 7th and 8th grade real-world COMMON CORE WORD PROBLEMS that students must solve and explain using problem-solving strategies. An ANSWER KEY has also been provided with examples of possible answers. Be sure to download the sample for a full overview of what you get.I created this problem-solving graphic organizer for my students who struggle solving WORD PROBLEMS and are unable to explain their work/solution. Each worksheet p
Subjects:
Grades:
6th - 10th
Types:
Entire Math Curriculum Bundle (All Math Resources)
⭐ This bundle includes ALL of my Math Curriculum in my Teachers Pay Teachers store ⭐You will be receiving ALL of my 6th, 7th, and 8th Grade Math interactive notebooks, activities, foldables, practice worksheets, warm-ups, exit slips, assessments, and much more! This is well over 1000 pages of material that I have created to help make math more enjoyable to students. My material also helps students to make connections to the real world.In addition to all of the math material in my store, you will
Subjects:
Grades:
5th - 10th
Types:
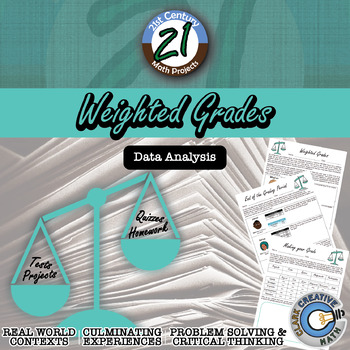
Weighted Grades -- Middle and High School - 21st Century Math Project
We know all points are not created equal, but do your students? In my experience the answer is a CAPITAL "no". If you have a weighted grade system, you know how these conversations with your students and your parents go. Make the math teacher next door review weighted averages!In this 21st Century Math Project, you will be given a mapping to the Content Standards, an outline for how to implement the project, handout resources for students to use, and an answer key. ***THIS PRODUCT HAS BEEN UPDAT
Subjects:
Grades:
6th - 12th
Types:
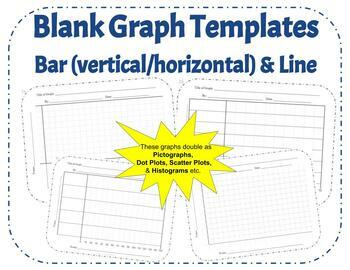
42 Blank Graph Templates: Horizontal & Vertical Bar Graph, Line Graph, Printable
Looking for an array of printable graph templates for all your future bar and line graph needs? Look no further! With 42 different templates ranging for bar graphs, to line graphs, varying in X values and Y values, this combination should be the last graph download you need to worry about for your class. These graphs can even be used as Histograms, Dot Plots, Scatter Plots, or a variety of other graphs to suit the needs of your classroom.I created this template to require all the basics of gr
Grades:
4th - 12th
Types:
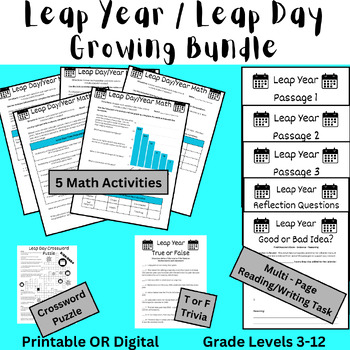
Leap Year (Leap Day) 2024 Bundle - Math, Reading, Writing, and Trivia
This bundle contains several fun and NO PREP activities to use to celebrate Leap Day 2024 (Leap Year 2024). Many contain a customizable digital resource (Google Document) and a printable resource (Canva) that contain the same directions and activity. These activities were designed for students in middle school, but could be used for upper elementary and high school students in Pre Algebra, Pre-Algebra, or Algebra.For more details on each product, click on the individual product to see the previe
Subjects:
Grades:
4th - 10th, Higher Education, Adult Education
Types:
Middle School/Upper Elementary Scientific Method and STEM Fair Unit
This unit was designed as a way to incorporate STEM into a more traditional Science Fair model with connections to STEM careers. Students are encouraged to choose a topic that they are deeply interested in and they learn how to connect scientific thinking to concepts outside of science class. They are also introduced to future STEM careers and community resources. The unit is directly aligned to Next Generation Science Standards (NGSS) and the Common Core.
In order to help students achieve t
Subjects:
Grades:
4th - 11th
Types:
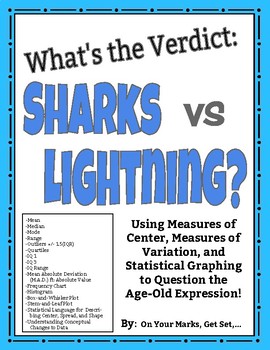
What's the Verdict: Sharks vs. Lightning? Modes of Center, Spread, and More!
Put it to the test! Use the age-old expression: "You are more likely to get struck by lightning than to be bitten by a shark!" to learn and practice Measures of Center, Measures of Spread, Measures of Shape, and Statistical Graphing including:MEANMEDIANMODERANGEOUTLIERS [Using IQR +/- 1.5(IQR)]QUARTILES [lower quartile (IQ-1) and upper quartile (IQ-3)]INTERQUARTILE RANGE (IQR)MEAN ABSOLUTE DEVIATION/ M.A.D. ft. ABSOLUTE VALUESYMMETRY/ASYMMETRY OF DISTRIBUTIONCLUSTERS AND GAPSBELL SHAPED CURVE AN
Subjects:
Grades:
5th - 12th, Higher Education, Adult Education
Types:
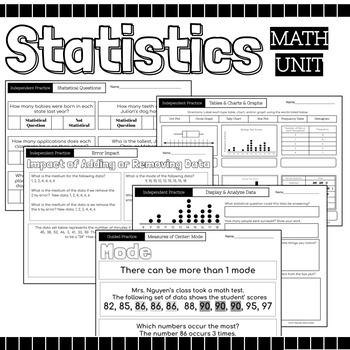
Statistics Math Packet {Data, Charts, Graphs, Mean, Median, Mode, Range, Spread}
52 Page Statics Unit Includes: Guided Instruction & Independent Practice Pages Usage Suggestions and IdeasThis resource can be utilized in numerous ways, here are some ideas:use for guided practiceassign as partner workassign as independent practicecan be used for morning workuse for reteaching in small group settinguse as review prior to assessmentuse as review in continuing to strengthen skillassign for homeworkuse as independent work during math centersTopicsRecognize Statistical Question
Subjects:
Grades:
4th - 12th
Analyzing a Frequency Table - Mean, Median, Mode, Range, Outlier
This product will help your students discover how outliers affect the measures of central tendency and range. By making calculations and analyzing data, students make conjectures and justify them in writing using mathematical reasoning and evidence.
What is included?
This product contains 2 student work pages centered around a set of data presented in a frequency table. The data includes an outlier. Students are required to calculate mean, median, mode, and range from each data display. Stu
Subjects:
Grades:
5th - 10th
Types:
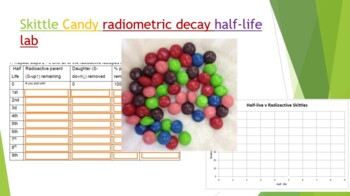
Skittle Radiometric Decay Half-life Lab
Did you know you can use Skittles candy to demonstrate absolute dating and radiometric decay! Buy a 1-4 lb bag at your local bulk warehouse store for savings. This lab is a great way to show how isotopes decay by shaking a plate full of random skittles. Students use Skittles to observe "Isotopes" decay over each half life. At the end of the lab (and only IF they have done all their work) they can enjoy their "daughter products". Skittles were used because they are durable, hypoallergenic, and th
Subjects:
Grades:
8th - 12th, Higher Education, Adult Education
Types:
NGSS:
HS-PS1-8
, HS-PS1-1
, HS-PS1-4
, HS-PS1-6
, MS-PS1-4
...
Also included in: Hands-on Science Semester Labs Bundle
Measures of Center & Variance Unit Bundle - Distance Learning Compatible
This is a selection of my Measures of Center & Variance resources all in a money saving Essential Bundle! You save significant money and time versus purchasing these separately!Essential Bundles are designed to give you everything you need to rock your unit. Warmups, Notes, Activities, Games, Exit Tickets, and Tests. You will find a selection of my Drive Instruction, Escapes, Boot Camp, Adventures, Whodunnits, CSI, Person Puzzles, STEM-ersions, Herowork, TableTop and my 21st Century Math Pro
Subjects:
Grades:
6th - 12th
Types:
Probability Project: March Madness
In this project, student will use their data analysis skills to research each teams' chance of winning the NCAA Tournament. Students will also use probability to fill in their own brackets for the tournament. This lesson is a fun way to incorporate March Madness into the math classroom.
Subjects:
Grades:
6th - 10th
Types:
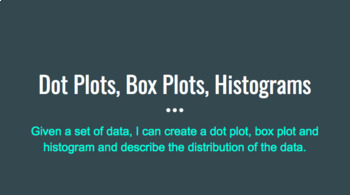
Dot Plots, Box Plots, Histograms Interactive Google Slides
This product has four data sets for students to consider. Students will work interactively on a google slide deck to create dot plots, box plots and histograms to represent each data set. The first slide is a video to review how to make a dot plot, box plot and histogram from a set of data. The next 13 slides are the examples for students to complete. The rest of the slide deck include the answer keys. For students who are doing Distance Learning and/or teachers with a digital platform such as
Subjects:
Grades:
6th - 10th
CCSS:
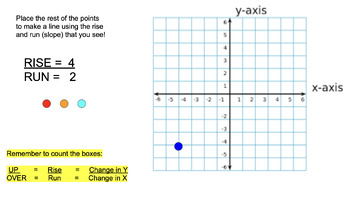
Coordinate Plane, Slope, Rise/Run, Graphing - Online No Prep Bundle
A bundle of activities which can be used as formal lessons or independent practice. Great for Google Classroom or Smart-boards! Also can be used as sub plans! Created by a Special Education Math Teacher to help students become comfortable with graphing!
Grades:
5th - 12th
Entire Algebra 1 Curriculum Bundle - The Notebook Curriculum
This bundle of 32 PowerPoint lessons includes all the Algebra concept PowerPoints I use when teaching my Algebra 1 course. All PowerPoints include the Student Note Taking Template, Completed Teacher Slide, and all the transitions for step-by-step instruction. These are the exact notebook pages I have students use to take notes in their notebooks using the The Notebook Curriculum.The PowerPoint Notebook Lessons included are:Finding Percents3 Types of Percent QuestionsSolving ProportionsCentral
Entire Pre-Algebra Curriculum Bundle - The Notebook Curriculum
This bundle of 32 PowerPoint lessons includes all the Algebra concept PowerPoints I use when teaching my Algebra 1 course. All PowerPoints include the Student Note Taking Template, Completed Teacher Slide, and all the transitions for step-by-step instruction. These are the exact notebook pages I have students use to take notes in their notebooks using the The Notebook Curriculum.The PowerPoint Notebook Lessons included are:Finding Percents3 Types of Percent QuestionsSolving ProportionsCentral
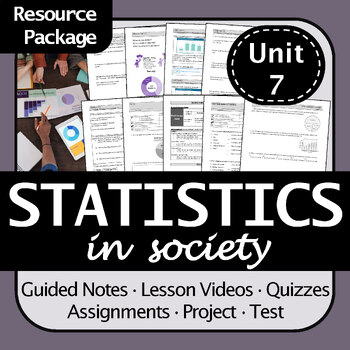
Statistics in Society Math 9 BC Resources: Notes, Practice, Quiz, Project, Test
This B.C. Math 9 resource package contains guided notes, assignments, quizzes, a review/study guide, and a test for an advanced unit on statistics in society.For my complete unit package (including activities, a mini-project, task cards, extension questions, and more): go here.With editable files in both .pdf and .docx formats, you have the flexibility to customize the content to suit your students' needs and your teaching style. The preview document contains images and information about every
Subjects:
Grades:
5th - 10th
Types:
NYS State Math Test Review Packet: 6th Grade
Aligned with the NYS State Math Test mathematics review sheet. Colorful, kid-friendly way to remind students to baseline at the beginning of the year or to review a full year of 6th grade skills and standards. Includes both straight computation and word problems. Can be used in gifted and talented programs as well or for enrichment for advanced learners or as skill review in HS basic skills or adult education programs in preparation for TASC or GED test.Intervention / MTSS / RTI / AIS / Special
Subjects:
Grades:
3rd - 12th, Higher Education, Adult Education, Staff
Types:
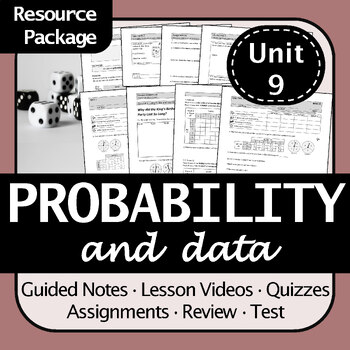
BC Math 8 Probability & Data Resources: Guided Notes, Practice, Quizzes, Test
This resource package contains guided notes, assignments, quizzes, a review/study guide, and a test for a unit on probability and statistics. For my complete BC Math 8 unit package (including activities, a mini-project, task cards, extension questions, and more): go here.With editable files in both .pdf and .docx formats, you have the flexibility to customize the content to suit your students' needs and your teaching style. The preview document contains images and information about every resour
Subjects:
Grades:
5th - 10th
Types:
Complete Lesson Collection - 62 Lessons 298 pages
Every lesson that Make Math More has ever created in one GIANT PDF download! 62 lessons and 298 Pages worth of real-life, engaging math activities. That makes it only $0.75 per lesson. Lesson Plans and Student Guides are included for every lesson. Most Common Core standards are covered in grades 6-8 (see contents below), but teachers have adapted and used my lessons well beyond these grade levels. See the full list below and enjoy the lessons!Candy Split - Students will use candy to explore what
Subjects:
Grades:
4th - 10th
Types:
Distribution of Data Quiz for Google Forms™ - 6.SP.2 - Distance Learning
About This Resource:This is a Google Forms Quiz on the distribution of data. The instructions are easy to follow for you to make a copy of the quiz to your Google Drive. Then you can assign to your students using Google Classroom or some other method.Questions on this assessment were carefully created to give our students the best practice on the following standard.6.SP.2 - Understand that a set of data collected to answer a statistical question has a distribution which can be described by its c
Subjects:
Grades:
6th - 10th
Types:
CCSS:
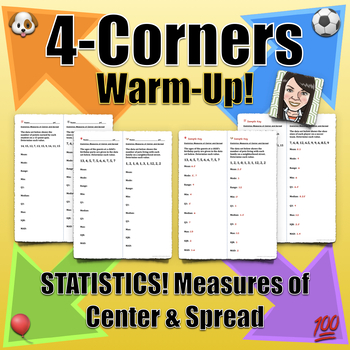
4-Corners Activity: STATISTICS! Measures of Center & Spread SPICE UP WARM-UPS!
Spice up your warm-up time and add a low-stakes formative assessment strategy to your repertoire! Get students moving and talking about math (and possibly arguing about math) by using this "4-Corners" strategy! Using 4 different sets of similar problems included here, students FIRST work individually on a brief set of problems. Students may not realize that there are 4 different versions of the problems floating around the classroom just yet! Then, after a few minutes of independent work, send s
Subjects:
Grades:
4th - 12th, Adult Education
Types:
Showing 1-24 of 101 results

