5 results
Easter Common Core 6.SP.A.2 resources
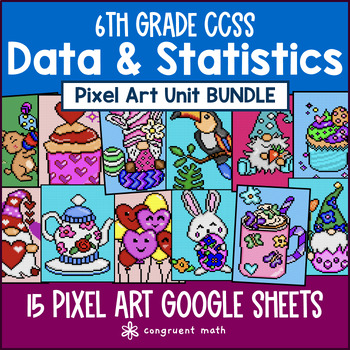
Data & Statistics Pixel Art Unit BUNDLE | 6th Grade CCSS
Students practice data & statistics including classifying statistical vs. non-statistical questions, classifying categorical vs. numerical data, identifying shapes of distribution, interpreting data in dot plots, histograms, stem-and-leaf plots, and box plots, measures of center (i.e. mean, median, mode), and measures of spread and variability (i.e. range, interquartile range, mean absolute deviations) with this 6th Grade CCSS Data and Statistics Pixel Art Unit Bundle. Contains 6 products wi
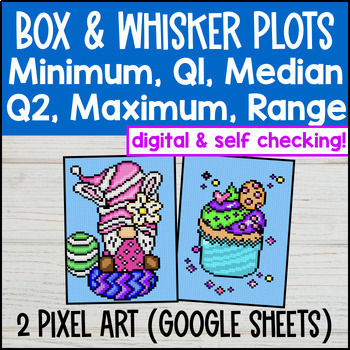
Box and Whisker Plots Digital Pixel Art | Range Interquartile Median Variability
Take box and whisker plots practice to the next level with pixel art! Students practice interpreting box and whisker plots (i.e. finding range, median, interquartile range) and calculating 5-number summaries (i.e. finding minimum, q1, median, q3, maximum) across 2 pixel art activities with 32 problems total. It's a perfect addition to your data & statistics unit.These self-checking Google Sheets give students instant feedback. Incorrect answers are highlighted in red, and correct answers tu
Subjects:
Grades:
5th - 7th
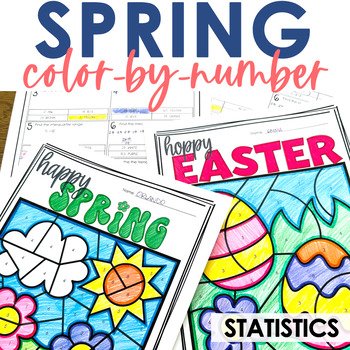
Spring & Easter Statistics Color by Number 7th Grade Math
Middle school math students will think this Statistics color-by-number practice is EGGcellent! Much better than a boring worksheet practicing measures of central tendencies, scatter plots, and stem & leaf plots! ;) It's the perfect middle school math activity with a little bit of fun! This engaging activity is also wonderful to leave with a substitute if you have to make sub plans! Just print and go!Students answer questions about statistics and then color the numbers that correspond to that
Subjects:
Grades:
7th - 9th
Types:
Also included in: 7th Grade Math Holiday Color By Number BUNDLE
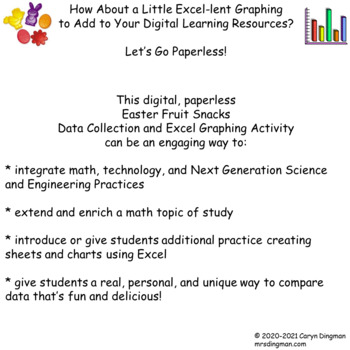
Excel Graphing Easter Fruit Snacks with Digital Student Directions
How About a Little Excel-lent Graphing to Add to Your Digital Learning Resources?Let’s Go Paperless!This digital, paperless Easter Fruit Snacks Data Collection and Excel Graphing Activitycan be an engaging way to:* integrate math, technology, and Next Generation Science and Engineering Practices* extend and enrich a math topic of study* introduce or give students additional practice creating sheets and charts using Excel* give students a real, personal, and unique way to compare data that’s fun
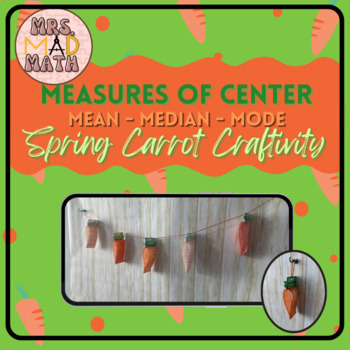
Spring/Easter Measures of Center Mean Median Mode Math Carrot Craftivity
Celebrate the spring season and make practicing measures of center fun with this 3-D carrot craftivity. Students will practice finding the mean, median, and mode of different data sets. Six different versions give you the option to assign one or multiple carrots per student. After determining the measures of center, students will cut, color, and assemble their 3-D carrots for display around the classroom. Should I really use coloring and craftivities in my upper elementary/middle school math cla
Grades:
5th - 7th
Types:
Showing 1-5 of 5 results

