57 results
Statistics assessments on sale
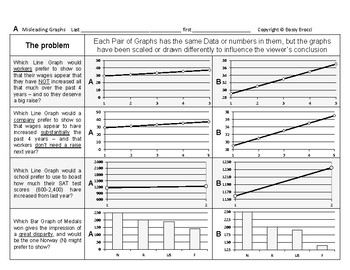
Stats&Data 14: Misleading & Misinterpreting Data Graphs Charts Statistics
This is an excerpt from my popular line ofBossy Brocci Math & Big Science workbooks on Amazon.ANSWER KEY included=======================Students will:1) Analyze 20 different Graphs or Data Displays2) Draw Conclusions & Answer questions about theaccuracy, fairness, limitations & legitimacy of those Graphs3) Answer 16 Multiple-choice questionsbased on their Calculations & Observations4) Be compelled to show their work in a neat & orderly format5) Be trained to methodically &
Subjects:
Grades:
Not Grade Specific
Types:
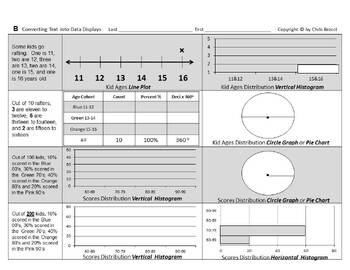
Stats&Data Bundle C: Data Displays Measures of Central Tendency & Variation
From the Author of Bossy BrocciMath & Big Science workbooks on Amazon,this Bundle of Data Displays,Measures of Central Tendency(Mean, Median, Mode & Range);and Measures of Variation(Quartiles, Interquartile Range, Outliers & Box Whisker plots)contains:11 Lessons32 Worksheets832 Problems & Tasks- and Assessment up the a$$=======================Answer KEYS included=======================Coverage Specifics:#1 Identify & Select Common Typesof Data DisplaysStudents will:1) Identi
Subjects:
Grades:
Not Grade Specific
Types:
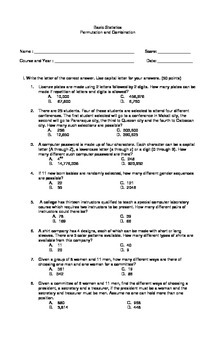
Probability and Statistics Multiple Choice on Permutation and Combination
Grab this Worksheet! a 25 multiple choice questions on probability's Permutation and Combination that will enhance and gain student's understanding on the topic!you can have this as a quiz or as a practice exercises in your class! a must have!!Viva Math!
Subjects:
Grades:
9th - 12th, Higher Education, Adult Education
Types:
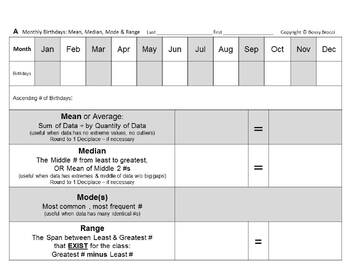
Stats&Data Bundle B: Birthdays Data Displays Variation Mean Median Mode Range
From the Author of Bossy BrocciMath & Big Science workbooks on Amazon,this Birthdays Stats (Mean, Median, Mode, Range),Measures of Variation & Data Displays Bundlecontains:2 Lessons12 Worksheets294 Problems & Tasks- and Assessment up the a$$=======================Answer KEY included=======================Coverage Specifics:#1 Author's Numbers Birthdays ProjectStudents will:1) Convert the given Monthly Birthdaysfrom Mr. Brocci's School numbers into:Ascending List/Data SetMeanMedianMod
Subjects:
Grades:
Not Grade Specific
Types:
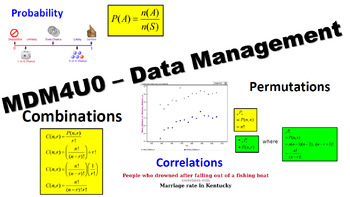
MDM4U - Assessment Bundle - Quizzes, Unit Tests, Assignments, Exam
This package contains ALL of the assessments included in my MDM4U Full Course Package bundle as editable Word documents. Inside you will find the following:Counting and Probability Unit:Permutations and Combinations1 Quiz with answer key + 3 Unit Tests with answer keys and extra versions + 1 assignment on probability in gamesProbability1 Quiz + 3 Unit Tests with answer keys and extra versions + 1 assignment on board game developmentProbability Distributions Unit: Probability Distribution3 Unit T
Subjects:
Grades:
12th
Types:
Análisis de datos y Probabilidad: Pictogramas y Tablas de frecuencias Gr. 3-5
Obtén una mayor comprensión sobe los pictogramas y las tablas de frecuencia con este atractivo recurso. Los conceptos incluyen: pictogramas, suma, tablas de frecuencia, resta. Este recurso, redactado para los estudiantes de tercer a quinto grado, se divide en tres secciones: Hojas de tarea con problemas de texto, seguido por Hojas de simulacro para practicar la competencia de los estudiantes en las habilidades procesales, y finalmente una prueba de evaluación. La clave de respuestas está incluid
Subjects:
Grades:
3rd - 5th
Types:
Data Analysis Statistics and Probability worksheets (63 Problems) (SAT Review)
Data analysis statistics and probability worksheets ,63 problemsSAT ReviewFraction and Data (29 Multiple choice questions)Statistic Problem (15 questions)Probability Word Problems This section contains 19 word problems about :Simple ProbabilityCounting PrincipleIndependent ProbabilityDependent ProbabilityMutually Exclusive EventsPermutationsCombinationsConditional Probability* AlSO AVAILABLE FOR YOU OR A COLLEAGUE! - CLICK ANY LINK YOU WANT:Number and Operations (SAT Review) Algebra & Functi
Subjects:
Grades:
7th - 12th, Higher Education, Adult Education, Staff
Types:
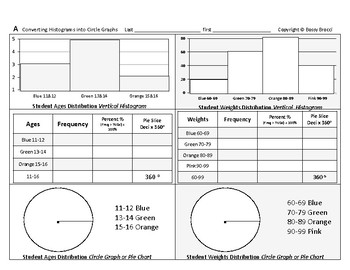
Stats&Data 03: Convert Histograms into Circle Graphs Construct Create Pie Charts
This is an excerpt from my popular line ofBossy Brocci Math & Big Science workbooks on Amazon.Answer KEY included=======================Students will:1) Convert 3 Vertical Histograms into3 Data Tablesand3 Colored or Shaded Circle Graphs (Pie Charts)2) Convert 1 Horizontal Histogram into1 Data Tableand1 Colored or Shaded Circle Graph (Pie Chart)3) Be compelled to show their work in a neat & orderly format4) Be trained to methodically & systematicallyPresent Data in different DisplaysN
Subjects:
Grades:
Not Grade Specific
Types:
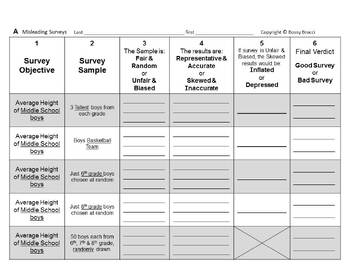
Stats&Data Bundle D: Misleading Misinterpreting Surveys Statistics Graphs Charts
From the Author of Bossy BrocciMath & Big Science workbooks on Amazon,this Bundle onMisleading & MisinterpretingSurveys, Statistics, and Graphs/Chartscontains:2 Lessons8 Worksheets78 Problems & Tasks- and Assessment up the a$$=======================Answer KEYS included=======================Coverage Specifics:#1 Misleading & Misinterpreting Surveys & Statistics+ QUIZStudents will:1) Read 10 different Surveys and Survey Samples2) Determine and Write if those Surveys are:Fair
Subjects:
Grades:
Not Grade Specific
Types:
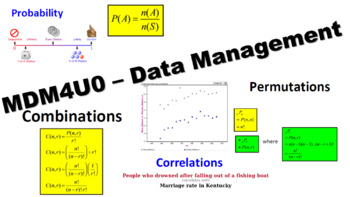
MDM4U - Grade 12 Math - Mathematics of Data Management - FULL COURSE!
This is my complete course package for the Grade 12 Data Management (MDM4U) course following the Ontario Secondary Mathematics Curriculum. This package includes:Smart Notebook and PowerPoint lessons with Student PDF versions for every lesson of every unit in the course. (I have also included versions with my notes for your use)A complete student workbook that covers every lesson in the course. Each lesson concludes with appropriate workbook sections, so you can use whatever textbook you want!App
Subjects:
Grades:
12th
CCSS:
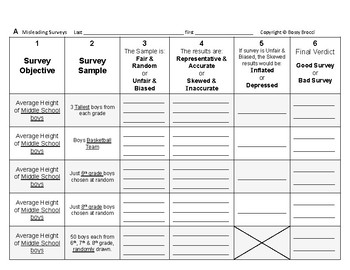
Stats&Data 13: Misleading & Misinterpreting Surveys & Statistics + QUIZ
This is an excerpt from my popular line ofBossy Brocci Math & Big Science workbooks on Amazon.ANSWER KEY included=======================Students will:1) Read 10 different Surveys and Survey Samples2) Determine and Write if those Surveys are:Fair & RandomUnfair & BiasedRepresentative & AccurateSkewed & InaccurateInflatedDepressedGood SurveyBad Survey3) Answer 24 Multiple-choice questionsbased on their Observations4) Analyze 5 Statistical Problems & Conclusions for accuracy
Subjects:
Grades:
Not Grade Specific
Types:
Análisis de datos y Probabilidad: Media, Mediana y Moda Gr. 6-8
Obtén una mayor comprensión sobre Media, Mediana y Moda con este atractivo recurso. Los conceptos incluyen: media, mediana, gama, moda, diagramas de caja y bigotes, cuartil inferior, diagrama de líneas, gráficas de líneas. Este recurso, diseñado para los grados de sexto a octavo, se divide en tres secciones: Hojas de tarea con problemas de texto, seguido por Hojas de simulacro para practicar la competencia de los estudiantes en las habilidades procesales, y finalmente una prueba de evaluación. L
Subjects:
Grades:
6th - 8th
Types:
MDM4U - Statistical Analysis Unit - Full Teacher Package
This is my complete Statistical Analysis Unit package for the Grade 12 Data Management (MDM4U) course following the Ontario Secondary Mathematics Curriculum. This package includes:Smart Notebook, PowerPoint lessons with Student PDF versions for every lesson in the unit.A complete student workbook that covers every lesson in the unit. Each lesson concludes with appropriate workbook sections, so you can use whatever textbook you want!Appropriate unit tests/quizzes/assignments with answer keys.A fu
Subjects:
Grades:
12th
MDM4U - Organization of Data for Analysis Unit - Full Teacher Package
This is my complete Organization of Data for Analysis Unit package for the Grade 12 Data Management (MDM4U) course following the Ontario Secondary Mathematics Curriculum. This package includes:Smart Notebook and PowerPoint lessons with Student PDF versions for every lesson in the unit.A complete student workbook that covers every lesson in the unit. Each lesson concludes with appropriate workbook sections, so you can use whatever textbook you want!Appropriate unit tests/quizzes/assignments with
Subjects:
Grades:
12th
MDM4U - Probability Distributions Unit - Full Teacher Package
This is my complete Probability Distributions Unit package for the Grade 12 Data Management (MDM4U) course following the Ontario Secondary Mathematics Curriculum. This package includes:Smart Notebook and PowerPoint lessons with Student PDF versions for every lesson in the unit.A complete student workbook that covers every lesson in the unit. Each lesson concludes with appropriate workbook sections, so you can use whatever textbook you want!Appropriate unit tests/quizzes/assignments with answer k
Subjects:
Grades:
12th
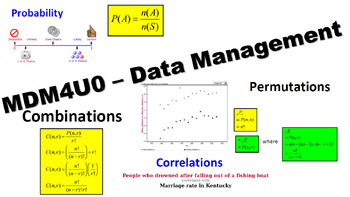
MDM4U - Counting and Probability Unit - Full Teacher Package
This is my complete Counting and Probability Unit package for the Grade 12 Data Management (MDM4U) course following the Ontario Secondary Mathematics Curriculum. This package includes:Smart Notebook and PowerPoint lessons with Student PDF versions for every lesson in the unit.A complete student workbook that covers every lesson in the unit. Each lesson concludes with appropriate workbook sections, so you can use whatever textbook you want!Appropriate unit tests/quizzes/assignments with answer ke
Subjects:
Grades:
12th

Análisis de datos y Probabilidad: Probabilidad Gr. PK-2
Tome un Interior de la Ojeada:
Obtén una mayor comprensión sobre Probabilidad con este atractivo recurso. Los conceptos incluyen: fracciones, tabla, ordenar, agrupar, suma, resta, posibilidad. Este recurso, diseñado para Pre-Kindergarten a segundo grado, está dividido en tres secciones: Hojas de tarea con problemas de texto, seguido por Hojas de simulacro para practicar la competencia de los estudiantes en las habilidades procesales, y finalmente una prueba de evaluación. La clave de respuesta
Subjects:
Grades:
PreK - 2nd
Types:
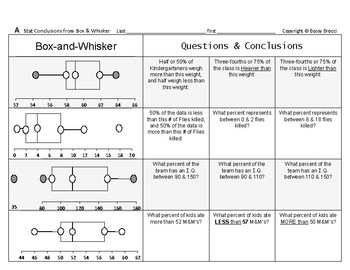
Stats&Data 09: Draw Statistical Conclusions from Box and Whisker Box Plots QUIZ
This is an excerpt from my popular line ofBossy Brocci Math & Big Science workbooks on Amazon.Answer KEY included=======================Students will:1) Analyze 8 Box & Whisker Plots (Box Plots)2) Answer at total of 24 questionsfrom those Plots regarding variousFraction & Percent Distribution portions3) Be compelled to show their work in a neat & orderly format4) Be trained to methodically & systematicallyTranslate or Convert Box & Whisker Plotsinto Fractions & Percen
Subjects:
Grades:
Not Grade Specific
Types:
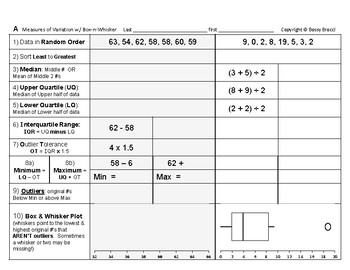
Stats&Data 06: Variation Quartiles Interquartile Range Outliers Box Whisker Plot
This is an excerpt from my popular line ofBossy Brocci Math & Big Science workbooks on Amazon.Answer KEY included=======================Students will:1) Sort or Sequence 8 different Data Sets or Sets of Numbers2) Calculate & Identify for each of the 8 Data Sets the:MedianUpper QuartileLower QuartileInterquartile RangeOutlier ToleranceAllowed MinimumAllowed Maximumandany Outliers3) Draw or Construct the Box and Whisker Plots (Box Plots)directly beneath their calculations4) Be compelled to
Subjects:
Grades:
Not Grade Specific
Types:
Análisis de datos y Probabilidad: Diagramas de barras y de círculo Gr. 3-5
Obtén una mayor comprensión sobre los gráficos de barras y los gráficos de círculo con este atractivo recurso. Los conceptos incluyen: gráficos de barras, probabilidad, gráficos de círculo, fracciones, porcentajes, redondear. Este recurso, redactado para los estudiantes de tercer a quinto grado, se divide en tres secciones: Hojas de tarea con problemas de texto, seguido por Hojas de simulacro para practicar la competencia de los estudiantes en las habilidades procesales, y finalmente una prueba
Subjects:
Grades:
3rd - 5th
Types:
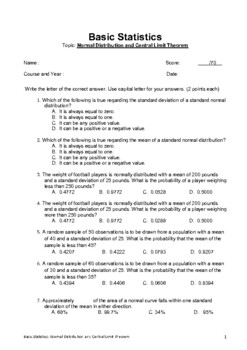
Statistics Multiple Choice Quiz: Normal Distribution and Central Limit Theorem
Basic StatisticsThis quiz covers:- Normal Distribution- Central Limit TheoremThis quiz contains 35 multiple choice questionsThe 35 multiple choice questions covers about terms, definition and calculations about Normal distribution and Central Limit Theorem.The questions in terms and definition in this multiple choice are simple this will test the understanding of students if they understand the concept of Normal Distribution and Central Limit Theorem.I have provided an answer key in this multipl
Subjects:
Grades:
8th - 12th, Higher Education, Adult Education
Types:
Análisis de datos y Probabilidad: Pictogramas Gr. PK-2
Tome un Interior de la Ojeada:
Obtén una mayor comprensión sobre Pictogramas con este atractivo recurso. Los conceptos incluyen: mayor, menor, suma, resta, estimación, posibilidad, probabilidad. Este recurso, diseñado para Pre-Kindergarten a segundo grado, está dividido en tres secciones: Hojas de tarea con problemas de texto, seguido por Hojas de simulacro para practicar la competencia de los estudiantes en las habilidades procesales, y finalmente una prueba de evaluación. La clave de respues
Subjects:
Grades:
PreK - 2nd
Types:
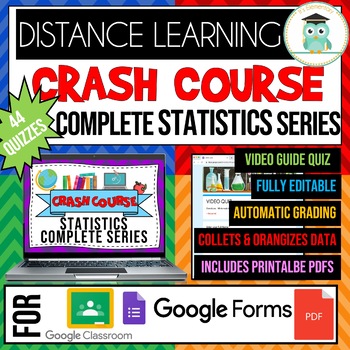
COMPLETE CRASH COURSE Statistics Series Video Quiz Google Forms Bundle
These are GOOGLE FORMS quizzes and printable PDF worksheets for 44 CRASH COURSE STATISTICS SERIES VIDEOS. Each product includes:2 Differentiated Versions of the QuizEasy Version (With a Word Bank)Harder Version (Without a Word Bank)These quizzes can be used as a video guide to hold students accountable as they watch the video. It can also be used as a video quiz to assess student learning or as part of homework. These quizzes can be assigned to your GOOGLE CLASSROOM for DISTANCE LEARNING.The GO
Subjects:
Grades:
9th - 12th, Higher Education, Adult Education
Types:
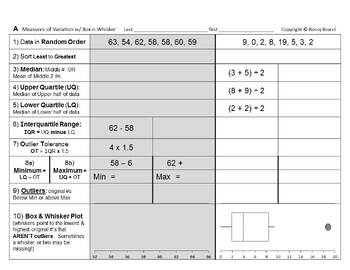
Stats&Data Bundle A: Box Whisker Box Plots & Measures of Variation bundle
Spun-off from my popular series of Bossy Brocci Math & Big Science Workbooks on Amazon,this Measures of Variation Box & WhiskerBox Plots Bundlecontains:4 Lessons10 Worksheets263 Problems & Tasks- and Assessment up the a$$=======================Answer KEYS included=======================Coverage Specifics:#1 From Quartiles Interquartile Range& Outliers to Box Whisker PlotsStudents will:1) Sort or Sequence 8 different Data Sets or Sets of Numbers2) Calculate & Identify for each
Subjects:
Grades:
Not Grade Specific
Types:
Showing 1-24 of 57 results


