71 results
Applied math Common Core 6.SP.B.5a resources
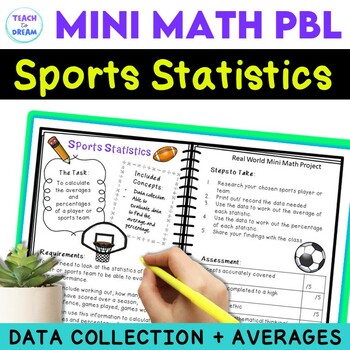
Inquiry Based Math Project | Data and Averages | Sports Statistics Grade 6th 7th
This Inquiry Based Math Project with the theme SPORTS STATISTICS, investigates percentages, averages and data. Students will be engaged and enjoy using numeracy in a real life situation. It has been designed for students in grades 4 to 7. Now suitable for in person and online learning with printable PDF and online Google slides.THE PERFECT WAY TO GET STUDENTS INTERESTED IN MATH!The projects are easy to follow and can either be teacher run or student driven. Each math project is designed to run b
Subjects:
Grades:
4th - 7th
Types:
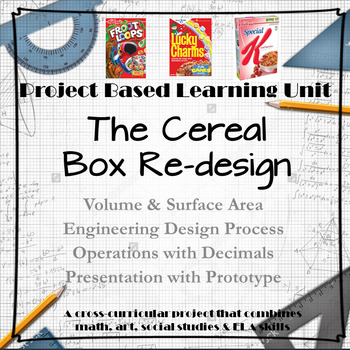
Project Based Learning: Math - Middle School - Cereal Box Project
This is a 6 week comprehensive Project Based Learning Unit that focuses on students redesigning the traditional Cereal Box. Students will work through the Engineering Design Process as well as learn the background mathematical concepts to create a newer version of a Cereal Container that decreases the Surface Area of materials while simultaneously increasing the total Volume. This unit targets 6th grade, but can be modified to meet standards for 5th and 7th grade. NO PREP REQUIRED, just download
Subjects:
Grades:
5th - 7th
NGSS:
MS-ETS1-2
, MS-ETS1-4
, MS-ETS1-1
, MS-ETS1-3
Also included in: 6th Grade Math Geometry Bundle - 8+ Week Unit (CCSS Aligned) plus PBL
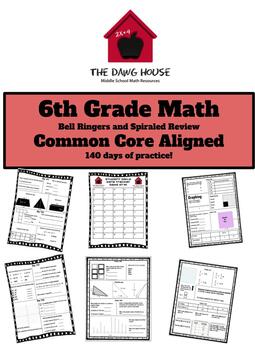
6th Grade Math Spiraled Bell Ringers/ Do-Nows
Is your district doing Distance Learning? This can be easily implemented and sent out for students to do at home! My students do these once a day to review old standards! ***Updated with full first Quarter Preview video**Why spend $15-50 on something that only takes 5-10 minutes to warm up your student's brains? Are you looking for 7th Grade BellRingers/Do-Nows/Brain Warm Ups?Need a great 6th Grade spiraled review end of year project? These were used in a diverse classroom with many students per
Subjects:
Grades:
6th - 8th
Types:
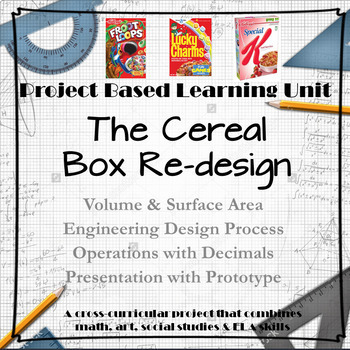
Project Based Learning - Cereal Box Redesign Project
This is a 6 week comprehensive Project Based Learning Unit that focuses on students redesigning the traditional Cereal Box. Students will work through the Engineering Design Process as well as learn the background mathematical concepts to create a newer version of a Cereal Container that decreases the Surface Area of materials while simultaneously increasing the total Volume. This unit targets 6th grade, but can be modified to meet standards for 5th and 7th grade. NO PREP REQUIRED, just download
Subjects:
Grades:
5th - 7th
NGSS:
MS-ETS1-2
, MS-ETS1-4
, MS-ETS1-1
, MS-ETS1-3
Also included in: 6th Grade Math - Full Year Curriculum Bundle - 2,000+ Pages
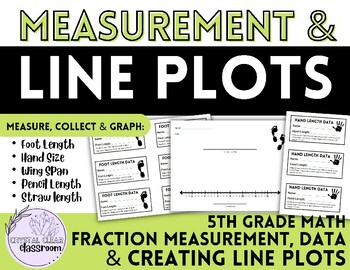
LINE PLOTS - Student Measurement, Data &Graphing Activity 5th-6th Grade math
Are you looking for a engaging way to teach your students how to collect data and create lines plots based on REAL data? This resource is all about measuring, collecting data, and graphing data using a line plot. This resource includes:Teacher InstructionsFoot Length Data Collection Card + Scaffolded line plots (3 options)Hand Length Data Collection Card + Scaffolded line plots (3 options)Wing Span Data Collection Card + Line PlotPencil Length Data Collection Card + Line PlotStraw Length Data Co
Subjects:
Grades:
4th - 6th
Types:
Also included in: Measurement and Data 5th Grade 4 RESOURCE BUNDLE + BONUS FREEBIE
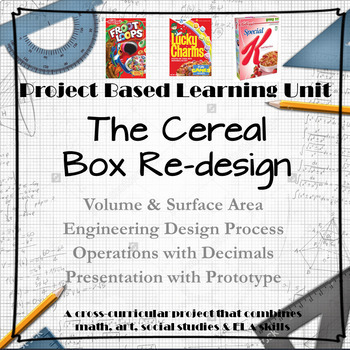
End of the Year Activity - Middle School Math- Cereal Box Redesign
This is a 6 week comprehensive Project Based Learning Unit that focuses on students redesigning the traditional Cereal Box. Students will work through the Engineering Design Process as well as learn the background mathematical concepts to create a newer version of a Cereal Container that decreases the Surface Area of materials while simultaneously increasing the total Volume. This unit targets 6th grade, but can be modified to meet standards for 5th and 7th grade. NO PREP REQUIRED, just download
Subjects:
Grades:
5th - 7th
NGSS:
MS-ETS1-2
, MS-ETS1-4
, MS-ETS1-1
, MS-ETS1-3
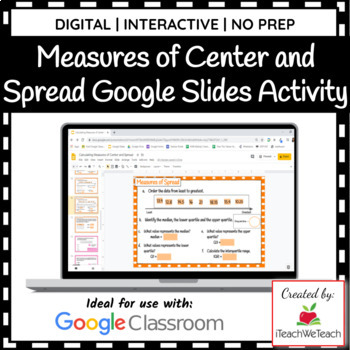
Measures of Center and Spread Google Slides Activity | Download & Go!
★ DIGITAL Math Resource★ Are you looking for quality, standards aligned math resources to use with Google Classroom™? This resource is a fun and engaging way for students for practice solving problems involving measures of center and spread. This product includes a Google Slides activity with 28 interactive slides with questions about mean, median, mode, range, and IQR.This activity is ideal for use with Google Classroom, but can be shared as a link on virtual classroom websites like Canvas, Sch
Subjects:
Grades:
6th - 7th
Types:
Also included in: Statistics Bundle | Google Slides Activities | Download & Go!
BIG IDEAS Math 6th Grade Chapter 9 Statistics GROWING BUNDLE
**Big Ideas Math 6th Grade Chapter 9 Statistics Bundle**Welcome to our comprehensive bundle tailored for Chapter 9 on Statistics in Big Ideas Math 6th Grade curriculum! This growing bundle is designed to provide you with an extensive array of resources to master statistical concepts effectively. We will continually update this bundle with new materials as they are created, ensuring you have access to the latest and most helpful resources for your learning journey.**Current Resources:** **Practi
Subjects:
Grades:
6th
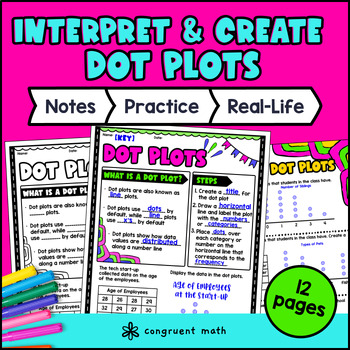
Construct & Interpret Dot Plots Guided Notes | Data & Statistics Color by Number
Introduce constructing and interpreting dot plots (line plots) with this 14-page packet of self-contained lesson! Includes guided notes with doodles, color by number activity, in class practice problems sheet, and real life application. It works well as a formal lesson, graphic organizer, scaffolded notes, or interactive notebooks. What's included... (12 pages total)✅ Guided Notes (3 pages).What is a dot plot?How to construct a dox plot from a data setHow to interpret a dot plot✅ Maze (1 page)
Subjects:
Grades:
6th
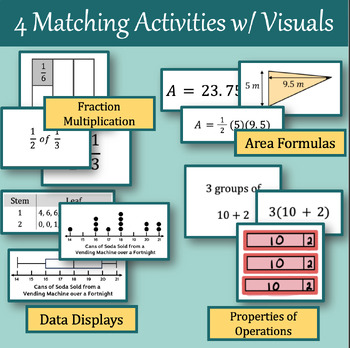
6th Grade Card Matching Activities with Multiple Representations with Visuals
Includes 4 card matching activities, saving $4.25 when purchased as a bundle. Data Displays - matching box plots, histograms, stem and leaf plots and dot plots that represent the same data. Includes teacher questions and discussion slidesArea Formulas - matching shapes with the correct area formula with the side lengths substituted in and the answers. Includes extension & independent practice.Properties of Operations - matching expressions using commutative, associative and distributive prop
Subjects:
Grades:
6th
Types:
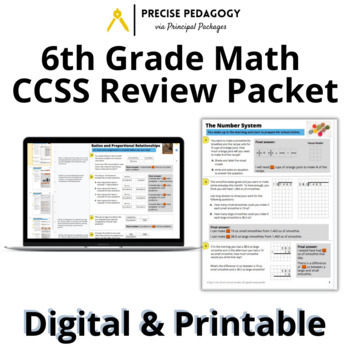
6th Grade Math CCSS Review Packet with Authentic Tasks
Looking for a good way to review 6th grade math concepts with your students? This math review packet covers all topics of 6th grade math in Common Core. This 6th Grade math spiral review resource can easily be used for 6th grade math concept review as homework or class activities to spark discussion and address misconceptions before the state test! This resource is great for 6th grade classroom teachers, homeschool teachers, and even tutors! If you are a 7th grade math teacher, this is a great
Subjects:
Grades:
6th
Social Media Math: Word Problems and Solutions, applying algebra and more
Use these 11 math word problems to reinforce essential problem-solving and communication skills, all couched in the context of social media and the internet. To solve these problems, knowledge of English language, arithmetic, fractions, decimals, percents, algebra, calculator use, logarithms and exponents, statistics, graphing, and other skills may be required. Solutions are given with explanations, including how to write and solve relevant equations, along with additional discussion questions
Subjects:
Grades:
Not Grade Specific
Types:
Complete Lesson Collection - 62 Lessons 298 pages
Every lesson that Make Math More has ever created in one GIANT PDF download! 62 lessons and 298 Pages worth of real-life, engaging math activities. That makes it only $0.75 per lesson. Lesson Plans and Student Guides are included for every lesson. Most Common Core standards are covered in grades 6-8 (see contents below), but teachers have adapted and used my lessons well beyond these grade levels. See the full list below and enjoy the lessons!Candy Split - Students will use candy to explore what
Subjects:
Grades:
4th - 10th
Types:
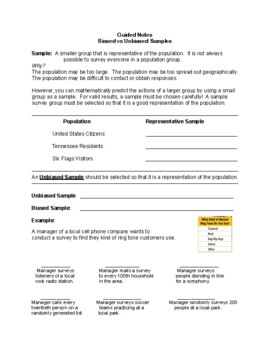
Biased v Unbiased Survey Samples: Notes and Independent Work
- Biased v Unbiased Survey Samples- Guided notes + Practice worksheet - Perfect for attaching to Interactive Math Notebook for reference- 1 page of notes- 1 independent assignment (2 page)- Answer key included
Subjects:
Grades:
6th - 7th
Florida B.E.S.T. Standards Review with Corresponding IXL Skills (6th Grade Math)
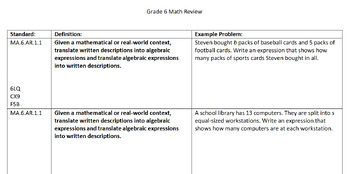
This is a tool I use at the end of the year to review standards that were covered throughout the school year. This assessment includes an example for EACH of the new Florida B.E.S.T. Standards for 6th grade math.I use this to diagnose where we need to review before they go to the next grade. It essentially has one question created from each of the standards, if everyone in your class gets that standard wrong, then bam you know where to review. I have also included a version with IXL
Subjects:
Grades:
6th
Create Dot or Line Plots and Histograms: Display Numerical Data 6th Grade Stats
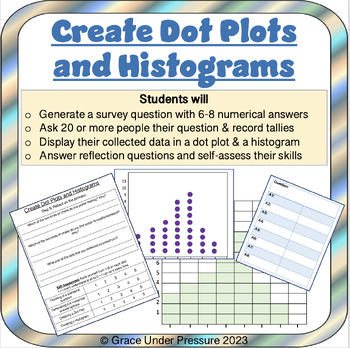
Help your 6th grade and middle school math students learn about statistics, data collection, and data presentation in a hands-on and meaningful way! In this product students will:- Generate their own survey question with 6-8 numerical answers (samples included)- Ask 20 or more people their question & record answers in a tally chart- Display their collected data in a dot plot or line plot and then a histogram (the blank templates are included so all students can be successful)- Answer reflect
Subjects:
Grades:
5th - 8th
Types:
Histograms Worksheet with Answer KEY Analyze Summarize Data Analysis
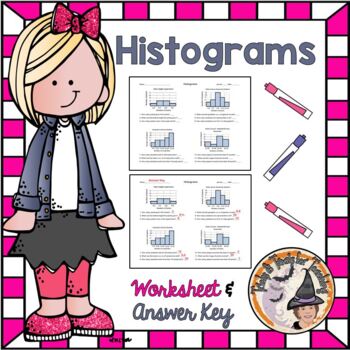
You will LOVE this Analyzing, Summarizing Data-Analysis worksheet using 4 different completed-Histograms with 12 questions. These really makes students stop and think. This would be super for Histogram-Homework. Zipfile comes with Worksheet, Answer-Key, and Smartboard slides with Worksheet and Answer-Key to add to your Histogram-Lesson. You'll enjoy using this year after year! Be sure to see my Histograms Smartboard Lesson, that is a great companion to this independent practice worksheet. IF YO
Subjects:
Grades:
4th - 7th
Types:
Yellowstone National Park Treasure Hunt Escape Room: Math Real World Questions
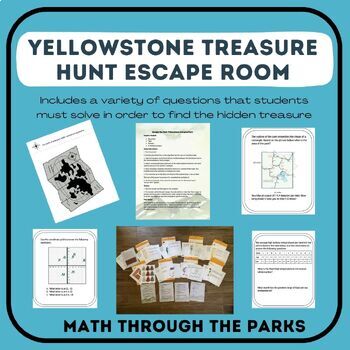
This escape the park activity is great for a variety of ages. Students will have an hour to complete all the questions to find a treasure. They will have to solve math problems with real world application in order to open separate lock boxes. If they don't make it in an hour the park will be closed. I have included multiple sets of questions that could be used for a variety of skill levels. You will need manilla folders to represent your lock boxes. The questions include a variety of readiness s
Subjects:
Grades:
3rd - 8th
Types:
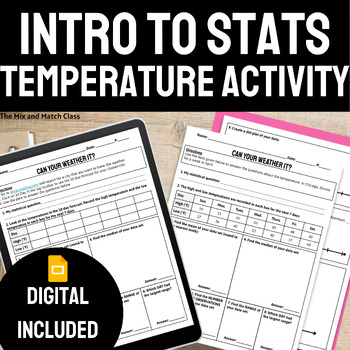
Statistics Activity Temperature Statistics Worksheet
Are you looking for a fun way to teach statistics to your students? Check out this awesome EDITABLE temperature themed statistics activity! This stats activity is designed to help students understand statistics by using real-world data. Tap into student interests by offering choices in which city’s temperatures to use. Editable and Differentiated: This activity is customizable to meet your students' needs. They can choose any city's temperatures to collect data and practice finding the mean, me
Subjects:
Grades:
6th - 7th
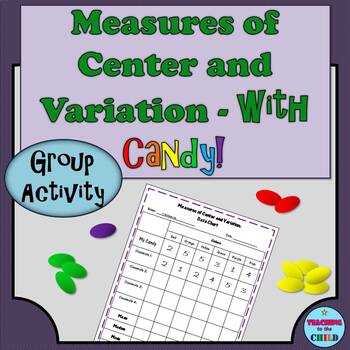
Measures of Center and Variation with Candy Group Activity
This activity is designed to give students a fun way to get extra practice in collecting data and finding the mean, median, mode and range of that data set. Templates are provided for using Skittles and M&M candies, but any multicolored candy can be used. This activity includes:- Directions- Data Charts for 5 or 10 students- Worksheets for Calculations- Template for Grouping
Subjects:
Grades:
5th - 7th
Types:
Basic Statistics Student Project
This project was originally used as the final assessment (in place of the one provided by EngageNY / Eureka Math) for the 6th grade statistics unit. It could also be used as a project to do as you move through the material to boost retention and engagement, or as a review for students in 7th grade and high school who are building on this material, especially as emergency sub plans!The product is built as a digital project, and includes common core alignment and a teacher checklist for use before
Subjects:
Grades:
6th - 12th
Types:
TCAP 6th Grade Math Do Nows - All Standards
Students answer fluency questions and aligned CCSS questions as a daily warm-up / do now / bellringer. It is a great way to incorporate spiral review in preparation for the TCAP. The first question focuses on a prerequisite skill from the previous grade level. Then there is guided practice. The fifth and final question is TCAP Practice question and will show students if a calculator is or is not permissible. Each day also includes fluency practice.
Subjects:
Grades:
6th
Types:
6th Grade Math Vocabulary: Data Sets and Distributions
This colorful set provides vocabulary words aligned with Unit 8 (Data Sets & Distribution) of the openup resources math program for 6thgrade. Included you will find:1. Word wall words for data sets & distributions (unit 8)2. Blank student copy of vocabulary sheets to complete definitions and examples3. Teacher copy of vocabulary sheets with completed definition and examples Words Included: numerical data, categorical data, dot plot, variability, statistical question, frequency, spread,
Subjects:
Grades:
5th - 7th
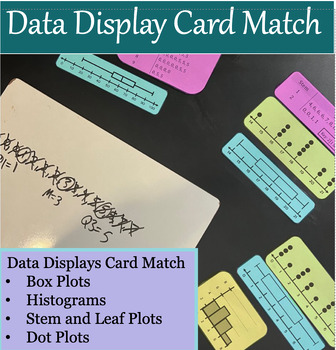
Data Displays Card Match 6th - Box Plots, Histograms, Stem and Leaf, & Dot Plots
Are you tired of teaching each data display in isolation? Use this card sort to help your students see the connections between the four representations of data: box plots, histograms, stem and leaf plots and dot plots. There are 15 sets of cards to match with 3 different displays of the same data in each match. Students will attend to the range, spread, median, mode and variability to tell which displays represent the same data sets. Questions to prompt student thinking and discussion questions/
Subjects:
Grades:
6th
Showing 1-24 of 71 results


