17 results
Graphing Common Core RST.6-8.4 resources
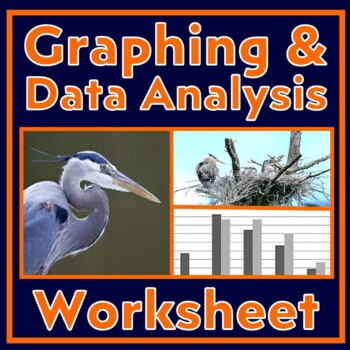
Data Analysis and Graphing Worksheet Scientific Method Practice (Herons)
Students build GRAPHING and DATA ANALYSIS skills. This activity provides a data table and an incomplete bar graph related to nesting habits of herons. Students follow directions that lead them through foundational graphing and data analysis skills. Instruction is built into the worksheet. This activity builds the following skills:Setting up bar graphs, including choosing intervals, labeling axes, and writing graph titles.Using data to make a bar graph (with an example already in place).Pulling
Subjects:
Grades:
6th - 9th
CCSS:
NGSS:
MS-LS2-2
, MS-LS2-1
, HS-LS2-1
, HS-LS2-2
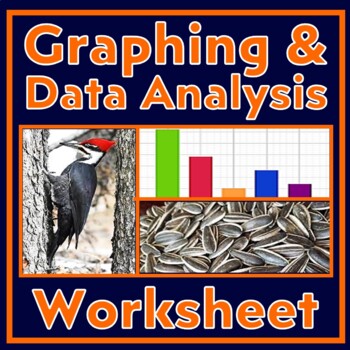
Graphing and Analyzing Data Activity with Scientific Method (Woodpeckers)
Use this data analysis and graphing worksheet to build GRAPHING and DATA ANALYSIS skills. This worksheet provides a data table from an experiment designed to find out which food woodpeckers prefer. Students follow directions that lead them through foundational graphing and data analysis skills, including making a bar graph and then analyzing it. Instruction is built into the worksheet. Students will practice the following skills in this activity:Setting up bar graphs, including choosing inter
Subjects:
Grades:
7th - 10th
CCSS:
NGSS:
MS-LS2-2
, MS-LS2-4
, HS-LS2-2
Science Bell Ringers Bundle
Discover the secret to better classroom management and student comprehension! Introducing science bell ringers, the ultimate solution to address your teaching challenges. Not only will they assist in strengthening classroom control and reinforcing student knowledge, but they also offer many other benefits. Each science bellringer includes a teacher presentation to use with your Smartboard. This will help create a classroom routine for students to start working immediately. Student printable shee
Subjects:
Grades:
6th - 8th
Types:
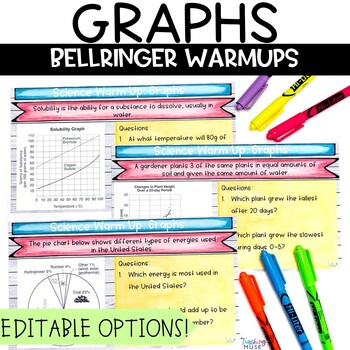
Bell Ringer Graphing in Science
Do your students need practice reading and understanding graphs? Add this bellringer to your science classroom routine this back to school season. The 20 graphs will help students warm up their science skills to analyze, interpret, and demonstrate their understanding of graphing. The graphs include an editable option to allow you to write questions specific to your classroom. This activity includes circle graphs, bar graphs, line graphs, and double line graphs. Students will: Analyze, interpret,
Subjects:
Grades:
6th - 8th
Types:
Also included in: Science Bell Ringers Bundle
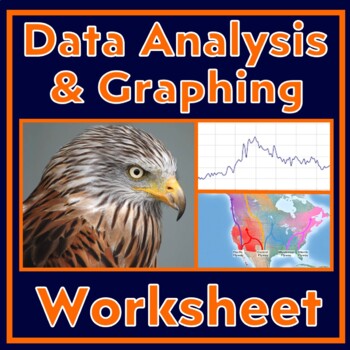
Scientific Method Worksheet Graphing and Data Analysis Practice (Falcons)
Use this data analysis and graphing worksheet to build GRAPHING and DATA ANALYSIS skills. This worksheet provides a data table about the distances that falcons travel. Students follow directions that lead them through graphing and data analysis skills, including making a line graph and then analyzing it.Instruction is built into the worksheet.Students will practice the following skills in this activity:Setting up line graphs, including choosing intervals, labeling axes, and writing graph titles.
Subjects:
Grades:
6th - 9th
CCSS:
NGSS:
MS-LS2-2
, MS-LS2-1
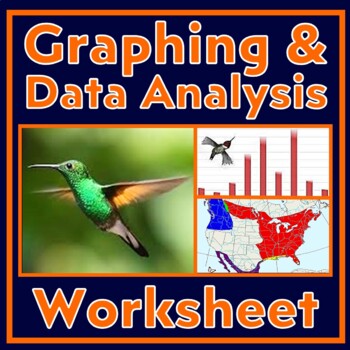
Scientific Method Worksheet Graphing and Analyzing Data Activity (Hummingbirds)
Build GRAPHING and DATA ANALYSIS skills! This worksheet provides a data table related to hummingbird migration. Students follow directions that lead them through graphing the data and analyzing it. Students will practice the following skills in this activity:Setting up bar graphs, including choosing intervals, labeling axes, and writing graph titles.Generating a bar graph from provided data.Pulling data from their graph.Data analysis that requires using data as evidence to support conclusions.R
Grades:
7th - 10th
CCSS:
NGSS:
MS-LS2-4
, MS-LS2-1
, HS-LS2-1
, HS-LS2-2
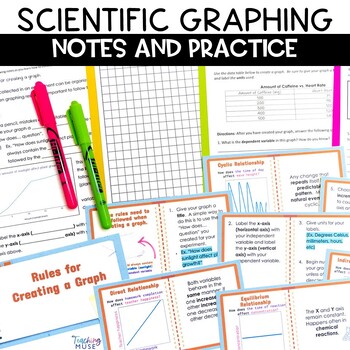
Graphing in Science Activity
Teach your students to create a graph in science, graph independent and dependent variables, and understand graphing relationships using this print and digital activity. This scientific graphing lesson includes a teacher presentation to introduce graphing rules, how to graph variables, and graphing relationships. Students will follow along on their fill in note sheet and complete the practice problems. In addition, there is a graphing assessment to track student progress. Students will learn: Gr
Subjects:
Grades:
6th - 8th
Types:
Graphing and Data Analysis Worksheet Scientific Method Practice (Juncos)
DATA ANALYSIS and GRAPHING ACTIVITY: Build science skills with real world data! This worksheet provides a data table and a line graph related to the months that one bird species visit bird feeders. Students follow directions that lead them through foundational graphing and data analysis skills. Students are not expected to make a graph from scratch, but are provided a scaffolded approach to practice these skills. Instruction is built into the worksheet. Students will practice the following
Subjects:
Grades:
6th - 9th
NGSS:
MS-LS2-2
, MS-LS2-4
Bacteria and Viruses Activity Packet, Worksheets, Microbiology Resources
A packet of resources when teaching the viruses and bacteria to your life science and biology students. This bundle contains NO PREP resources that are ready to be used.Note: there are no PowerPoints in this BundleMicrobiology PageTerms of UseCopyright © Dr. Dave's Science. All rights reserved by author. This product is strictly for individual use and may not be copied or given to other teachers. Copying any part of this product and placing it on the Internet in any form (even a personal/classr
Subjects:
Grades:
7th - 10th
Types:
CCSS:
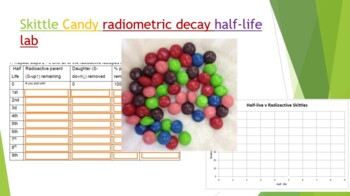
Skittle Radiometric Decay Half-life Lab
Did you know you can use Skittles candy to demonstrate absolute dating and radiometric decay! Buy a 1-4 lb bag at your local bulk warehouse store for savings. This lab is a great way to show how isotopes decay by shaking a plate full of random skittles. Students use Skittles to observe "Isotopes" decay over each half life. At the end of the lab (and only IF they have done all their work) they can enjoy their "daughter products". Skittles were used because they are durable, hypoallergenic, and th
Subjects:
Grades:
8th - 12th, Higher Education, Adult Education
Types:
NGSS:
HS-PS1-8
, HS-PS1-1
, HS-PS1-4
, HS-PS1-6
, MS-PS1-4
...
Also included in: Hands-on Science Semester Labs Bundle
Scientific Method Activity Practice Data Analysis Qualitative and Quantitative
This activity has students collect QUALITATIVE and QUANTITATIVE DATA about the candy in a mixed pack, such as Skittles or M&Ms. There are many candy activities out there, but none quite covered the quantitative and qualitative skills I wanted my middle school students to practice, so I designed my own! This lab is designed to be simple so that students can master beginner lab and data collection skills.In this activity, students will:READ an article about the differences between qualitativ
Subjects:
Grades:
6th - 8th
Types:
Also included in: Introduction to Experimentation Activity Set for Middle School Science
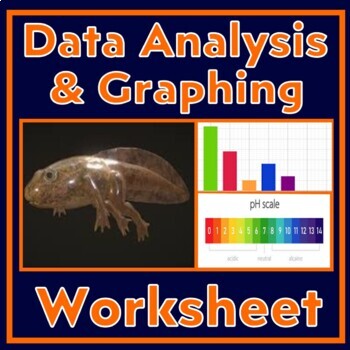
Scientific Method Worksheet Graphing and Analyzing Data Activity (Tadpoles)
Build GRAPHING and DATA ANALYSIS skills! This worksheet provides a data table related to tadpoles and the pH of water. Students follow directions that lead them step-by-step through graphing the data and analyzing it.Students will practice the following skills in this activity:Setting up bar graphs, including choosing intervals, labeling axes, and writing graph titles.Generating a bar graph from provided data.Pulling data from their graph.Data analysis that requires using data as evidence to sup
Grades:
6th - 9th
CCSS:

bar graph pie graph graphing thermometer lab PowerPoint STEM 3 4 5 6 TX TEKS
This fun, hands-on, lab and graphing activity gets your students thinking deeply and putting their knowledge of graphing, gathering data, and following instructions to the test. Perfect for test prep! Great way to incorporate science, technology, engineering, and math (STEM) concepts into a fun lesson. This lesson was created for elementary and middle school students and is great practice to help students reinforce the concepts of graphing, data gathering, creating bar graphs, creating pie graph
Subjects:
Grades:
3rd - 6th
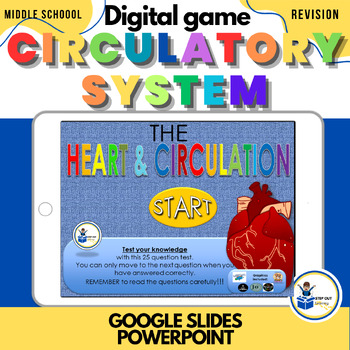
Circulatory system digital activities, worksheet, 7th grade science
Inspire independent consolidation, with this Digital interactive game designed to help your students master the concepts, structures and functions of the heart and circulation. There are five interactive activities (25 questions) to complete. Each activity will test for understanding of keywords, question types and applying knowledge to graphs.The colorful game is self-correcting, providing feedback after each activity. All five activities must be completed to win the game. Students succeed as
Subjects:
Grades:
6th - 9th
CCSS:
NGSS:
MS-LS1-3
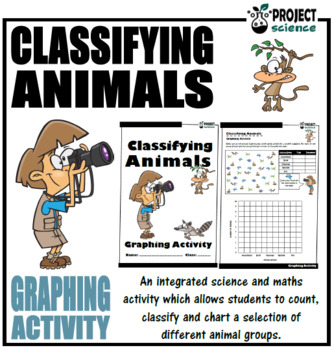
Classifying Animals Graphing Activity
A graphing activity that integrates science and maths. Students count the number of each animal [amphibians, birds, mammals, reptiles and fish] from a selection of animals and then record a tally and frequency and finally create a bar chart.If you would like updates on free and new products please follow me by clicking the Follow Me link above.A great accompaniment and support for the above resource.Classifying Animals Activity BookletClassifying Animals PowerPoint PresentationClassifying Animal
Grades:
4th - 7th
Types:
Introduction to Graphing Lesson with Power Point and Assignment
This presentation includes a lot of the basic terms that students need to build a base for future mathematics courses. These principles are used in geometry, algebra, and trigonometry. I have used this as low as the eighth grade level and collegiate courses.
Key Terms:
Graph
Axes
Ordered Pairs
x-intercept
y-intercept
Distance Formula
This presentation has been left as a pptx file so animations can be added or taken away if they buyer wishes. The preview file is a pdf of the presentation. Both
Subjects:
Grades:
6th - 12th, Higher Education, Adult Education
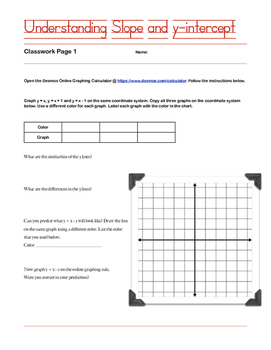
Understanding slope and y-intercept of linear equations
Use this worksheet to introduce slope-intercept form of linear equations or to get a deeper understanding to slope and y-intercept.
This worksheet uses a free online graphing calculator called desmos.
Created by Heidib.
Grades:
8th
Types:
Showing 1-17 of 17 results


