11 results
Earth sciences Common Core 6.SP.A.2 resources
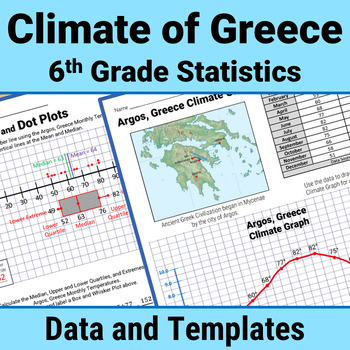
Greece Geography 6th Grade Statistics Box Plot Histogram Mean Median Activity
Enrich your study of Ancient Greece using 6th Grade stats skills to analyze Greek climate data. Calculate Measures of Central Tendency (mean, median, mode, range) and Mean Absolute Deviation. Master Data Display with Box and Whisker Plots, Histograms, Dot Plots, Stem and Leaf Charts. Write Statistical Questions. Analyze Data Distribution and Data Variability.All with climate data (temperature and precipitation) from Greece!This Print and Go STEM/STEAM PBL resource includes 70+ pages of climate d
Subjects:
Grades:
6th - 8th
NGSS:
MS-ESS2-6
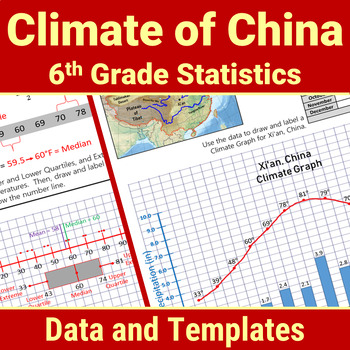
China Geography 6th Grade Statistics Box Plot Histogram Mean Median Activity
Enrich your study of Ancient China using 6th Grade statistics and Probability skills to analyze China climate data. Calculate Measures of Central Tendency (mean, median, mode, range) and Mean Absolute Deviation. Master Data Display with Box and Whisker Plots, Histograms, Dot Plots, Stem and Leaf Charts. Write Statistical Questions. Analyze Data Distribution and Data Variability.All with climate data (temperature and precipitation) from China!This Print and Go STEM/STEAM PBL resource includes 70
Subjects:
Grades:
6th - 8th
NGSS:
MS-ESS2-6
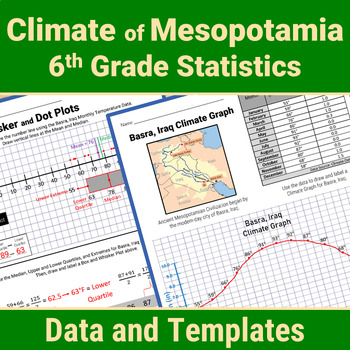
Mesopotamia Geography 6th Grade Statistics Box Plot Mean Median Mode Activity
Enrich your study of Mesopotamia using 6th Grade stats skills to analyze Mesopotamian climate data. Calculate Measures of Central Tendency (mean, median, mode, range) and Mean Absolute Deviation. Master Data Display with Box and Whisker Plots, Histograms, Dot Plots, Stem and Leaf Charts. Write Statistical Questions. Analyze Data Distribution and Data Variability.All with climate data (temperature and precipitation) from Iraq and Turkey!This Print and Go STEM/STEAM resource includes 70+ pages of
Subjects:
Grades:
6th - 8th
NGSS:
MS-ESS2-6
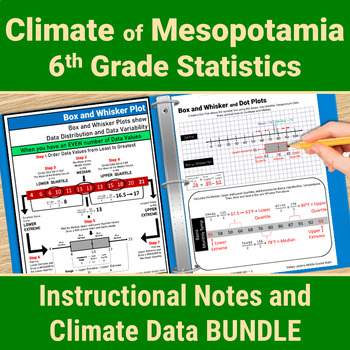
Mesopotamia Geography 6th Grade Statistics Mean Median Mode Box Plot Activity
Enrich your study of Mesopotamia using 6th Grade stats skills to analyze Mesopotamian climate data. Master Data Display with Box and Whisker Plots, Histograms, Dot Plots, Stem and Leaf Charts. Calculate Measures of Central Tendency (mean, median, mode, range) and Mean Absolute Deviation. Write Statistical Questions. Analyze Data Distribution and Data Variability.All with climate data (temperature and precipitation) from Iraq and Turkey!This Print and Go STEM/STEAM PBL resource includes 120 pages
Subjects:
Grades:
6th - 8th
NGSS:
MS-ESS2-6
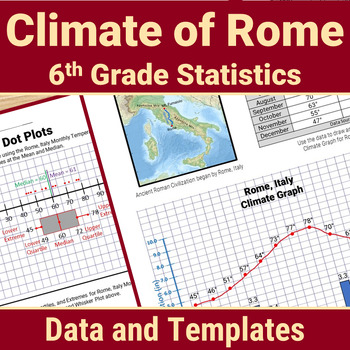
Rome Geography 6th Grade Statistics Box Plot Histogram Mean Median Mode Activity
Enrich your study of Ancient Rome using 6th Grade stats skills to analyze Italy climate data. Calculate Measures of Central Tendency (mean, median, mode, range) and Mean Absolute Deviation. Master Data Display with Box and Whisker Plots, Histograms, Dot Plots, Stem and Leaf Charts. Write Statistical Questions. Analyze Data Distribution and Data Variability.All with climate data (temperature and precipitation) from Rome!This Print and Go STEM/STEAM PBL resource includes 70+ pages of climate data
Subjects:
Grades:
6th - 8th
NGSS:
MS-LS2-1
, MS-ESS2-6
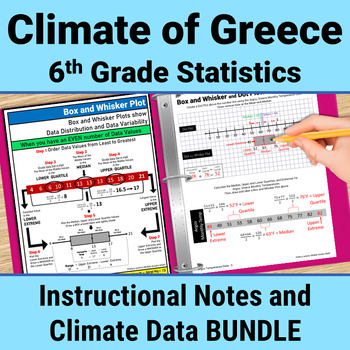
Greece Geography 6th Grade Statistics Mean Median Mode Range Box Plot Activity
Enrich your study of Ancient Greece using 6th Grade statistics skills to analyze Greek climate data. Master Data Display with Box and Whisker Plots, Histograms, Dot Plots, Stem and Leaf Charts. Calculate Measures of Central Tendency (mean, median, mode, range) and Mean Absolute Deviation. Write Statistical Questions. Analyze Data Distribution and Data Variability.All with climate data (temperature and precipitation) from Greece!This Print and Go STEM/STEAM PBL resource includes 120 pages of Inst
Subjects:
Grades:
6th - 8th
Types:
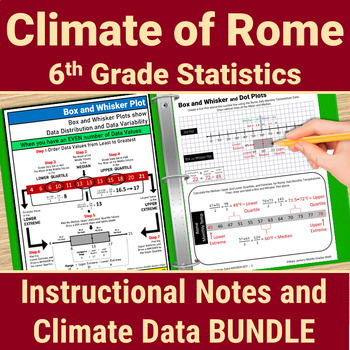
Rome Geography 6th Grade Statistics Mean Median Mode Box Plot Histogram Activity
Enrich your study of Ancient Rome using 6th Grade Statistics and Probability skills to analyze Italy climate data. Master Data Display with Box and Whisker Plots, Histograms, Dot Plots, Stem and Leaf Charts. Calculate Measures of Central Tendency (mean, median, mode, range) and Mean Absolute Deviation. Write Statistical Questions. Analyze Data Distribution and Data Variability.All with climate data (temperature and precipitation) from Rome!This Print and Go STEM/STEAM PBL resource includes 120 p
Subjects:
Grades:
6th - 8th
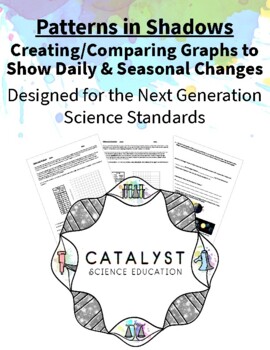
Patterns in Shadows - Creating/Comparing Graphs to Show Daily & Seasonal Changes
As the Earth rotates, it creates a daily pattern of shadows that students can observe and measure through hands-on activities. But the Earth moves in other ways, including revolution. This activity allows students to explore both ideas: that shadows change daily and shadows change seasonally. Students create graphs, then compare those graphs in order to make sense of Earth’s movements. Finally, students use this information to predict how long it takes for Earth to revolve around the Sun one tim
Subjects:
Grades:
5th - 8th
Types:
NGSS:
5-ESS1-2
, MS-ESS1-1
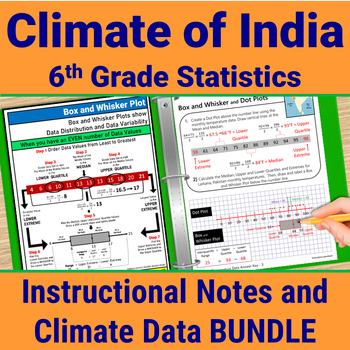
India Geography 6th Grade Statistics Mean Median Mode Range Box Plot Activity
Enrich your study of India using 6th Grade stats skills to analyze India climate data. Master Data Display with Box and Whisker Plots, Histograms, Dot Plots, Stem and Leaf Charts. Calculate Measures of Central Tendency (mean, median, mode, range) and Mean Absolute Deviation. Write Statistical Questions. Analyze Data Distribution and Data Variability.All with climate data (temperature and precipitation) from ancient Indian sites!This Print and Go STEM/STEAM PBL resource includes 120 pages of Inst
Subjects:
Grades:
6th - 8th
NGSS:
MS-ESS2-6
Normal Distribution - Bell Curve - with Google Sheets —Distance Learning
A normal distribution curve is better known as the Bell Curve. The information in the curve represents information that occurs naturally. This information is things like test scores or people’s height. A normal distribution curve is a statistical tool. It uses other statistical methods. These include Mean, Mode, and Median. Mean is another term for average. This exercise uses data from NOAA. The curve in the lesson represents the earthquake Magnitudes as collected by NOAA. NOAA is the National O
Subjects:
Grades:
4th - 12th
Types:
Excel Graphing Temperature Comparison
What's the temperature like in YOUR town? Does your curriculum include a study of weather factors? This Temperature Comparison Excel double-bar graph project can be an engagingway to:* integrate technology, math, science, and geography* introduce, extend, or enrich a math, social studies, or science topic of study* introduce or practice creating sheets and charts using Excel* give students a chance to make connections across the content areasThis classroom-tested project file includes: * student
Grades:
4th - 6th
Types:
NGSS:
5-ESS1-2
, 3-ESS2-1
, 3-ESS2-2
, 5-ESS2-1
, MS-ESS2-6
...
Showing 1-11 of 11 results


