21 results
Earth sciences Common Core 6.SP.B.5 resources
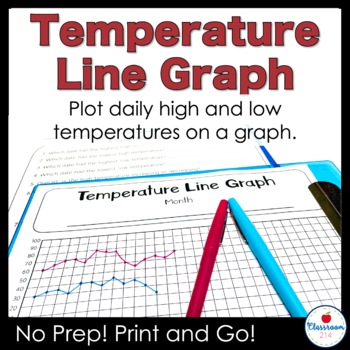
Weather Temperature Graph with Data Analysis Questions
Graph daily high and low temperatures on a line graph. At the end of the month, use the data analysis questions to promote critical thinking about temperature trends and practice graph reading skills. A perfect a weather unit, bell ringer or morning work assignment to sharpen math, earth science, and data analysis skills. WHAT'S INCLUDEDFahrenheit graph (-20 - 100 degrees Fahrenheit)Celsius graph (-20 - 40 degrees Celsius)Seven data analysis questions to be completed at the end of the monthAD
Subjects:
Grades:
2nd - 8th
Types:
NGSS:
3-ESS2-1
, MS-ESS2-5
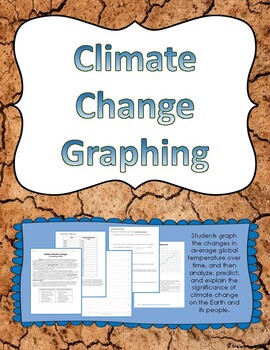
Climate Change Graphing Activity
Students graph the changes in average global temperature over time, and then analyze, predict, and explain the significance of climate change on the Earth and its people.Students read info related to climate change, then create a graph of average global temperature changes over the past 140 years. Students are then to answer several analysis questions, which could also be used to drive a meaningful classroom discussion about climate change.Included is a teacher's key which shows what the resulti
Subjects:
Grades:
5th - 11th
Types:
CCSS:
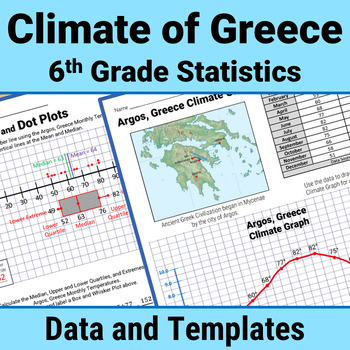
Greece Geography 6th Grade Statistics Box Plot Histogram Mean Median Activity
Enrich your study of Ancient Greece using 6th Grade stats skills to analyze Greek climate data. Calculate Measures of Central Tendency (mean, median, mode, range) and Mean Absolute Deviation. Master Data Display with Box and Whisker Plots, Histograms, Dot Plots, Stem and Leaf Charts. Write Statistical Questions. Analyze Data Distribution and Data Variability.All with climate data (temperature and precipitation) from Greece!This Print and Go STEM/STEAM PBL resource includes 70+ pages of climate d
Subjects:
Grades:
6th - 8th
NGSS:
MS-ESS2-6
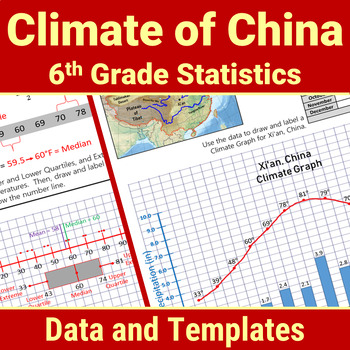
China Geography 6th Grade Statistics Box Plot Histogram Mean Median Activity
Enrich your study of Ancient China using 6th Grade statistics and Probability skills to analyze China climate data. Calculate Measures of Central Tendency (mean, median, mode, range) and Mean Absolute Deviation. Master Data Display with Box and Whisker Plots, Histograms, Dot Plots, Stem and Leaf Charts. Write Statistical Questions. Analyze Data Distribution and Data Variability.All with climate data (temperature and precipitation) from China!This Print and Go STEM/STEAM PBL resource includes 70
Subjects:
Grades:
6th - 8th
NGSS:
MS-ESS2-6
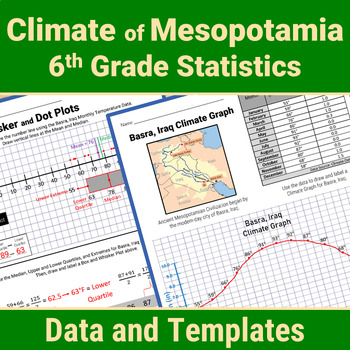
Mesopotamia Geography 6th Grade Statistics Box Plot Mean Median Mode Activity
Enrich your study of Mesopotamia using 6th Grade stats skills to analyze Mesopotamian climate data. Calculate Measures of Central Tendency (mean, median, mode, range) and Mean Absolute Deviation. Master Data Display with Box and Whisker Plots, Histograms, Dot Plots, Stem and Leaf Charts. Write Statistical Questions. Analyze Data Distribution and Data Variability.All with climate data (temperature and precipitation) from Iraq and Turkey!This Print and Go STEM/STEAM resource includes 70+ pages of
Subjects:
Grades:
6th - 8th
NGSS:
MS-ESS2-6
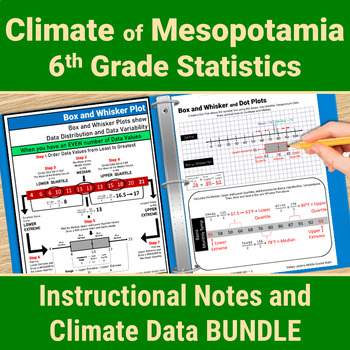
Mesopotamia Geography 6th Grade Statistics Mean Median Mode Box Plot Activity
Enrich your study of Mesopotamia using 6th Grade stats skills to analyze Mesopotamian climate data. Master Data Display with Box and Whisker Plots, Histograms, Dot Plots, Stem and Leaf Charts. Calculate Measures of Central Tendency (mean, median, mode, range) and Mean Absolute Deviation. Write Statistical Questions. Analyze Data Distribution and Data Variability.All with climate data (temperature and precipitation) from Iraq and Turkey!This Print and Go STEM/STEAM PBL resource includes 120 pages
Subjects:
Grades:
6th - 8th
NGSS:
MS-ESS2-6
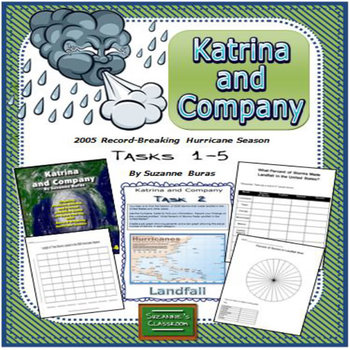
Hurricanes, Fractions to Percents, Statistics, Graphing: Katrina & Co. Tasks 1-5
These statistic tasks related to hurricanes are perfect for math centers, individual or partner work. Katrina and Company, Tasks 1-5, consists of 5 activities dealing with analyzing data related to the 2005 Record-Breaking Hurricane Season of 27 named storms. Students use charts to record information on 4 questions: (1) What percent of storms were in each category? (2) What percent of storms made landfall in the U.S.? (3) What percent of storms lasted the longest? and (4) What percent of storms
Subjects:
Grades:
4th - 7th
Types:
Also included in: Graphing and Analyzing Data: Katrina and Company: Bundle
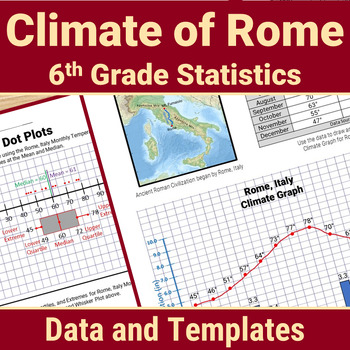
Rome Geography 6th Grade Statistics Box Plot Histogram Mean Median Mode Activity
Enrich your study of Ancient Rome using 6th Grade stats skills to analyze Italy climate data. Calculate Measures of Central Tendency (mean, median, mode, range) and Mean Absolute Deviation. Master Data Display with Box and Whisker Plots, Histograms, Dot Plots, Stem and Leaf Charts. Write Statistical Questions. Analyze Data Distribution and Data Variability.All with climate data (temperature and precipitation) from Rome!This Print and Go STEM/STEAM PBL resource includes 70+ pages of climate data
Subjects:
Grades:
6th - 8th
NGSS:
MS-LS2-1
, MS-ESS2-6
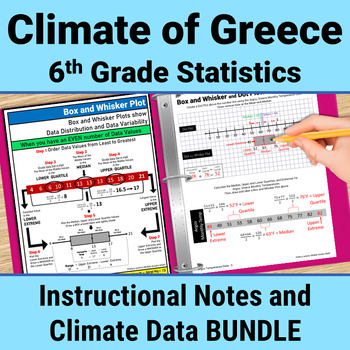
Greece Geography 6th Grade Statistics Mean Median Mode Range Box Plot Activity
Enrich your study of Ancient Greece using 6th Grade statistics skills to analyze Greek climate data. Master Data Display with Box and Whisker Plots, Histograms, Dot Plots, Stem and Leaf Charts. Calculate Measures of Central Tendency (mean, median, mode, range) and Mean Absolute Deviation. Write Statistical Questions. Analyze Data Distribution and Data Variability.All with climate data (temperature and precipitation) from Greece!This Print and Go STEM/STEAM PBL resource includes 120 pages of Inst
Subjects:
Grades:
6th - 8th
Types:
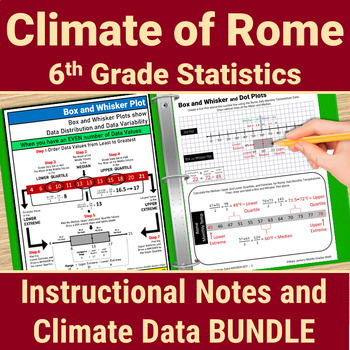
Rome Geography 6th Grade Statistics Mean Median Mode Box Plot Histogram Activity
Enrich your study of Ancient Rome using 6th Grade Statistics and Probability skills to analyze Italy climate data. Master Data Display with Box and Whisker Plots, Histograms, Dot Plots, Stem and Leaf Charts. Calculate Measures of Central Tendency (mean, median, mode, range) and Mean Absolute Deviation. Write Statistical Questions. Analyze Data Distribution and Data Variability.All with climate data (temperature and precipitation) from Rome!This Print and Go STEM/STEAM PBL resource includes 120 p
Subjects:
Grades:
6th - 8th
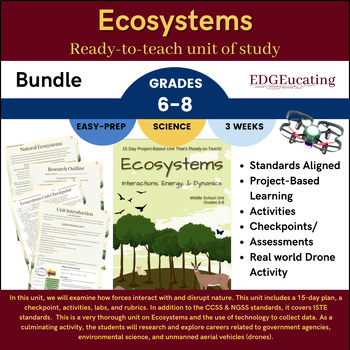
Ecosystems Middle School Unit
Science addresses questions about the natural and material world. In this unit, we will be exploring these connections in more depth. We will examine how forces interact with and disrupt nature. This unit includes a 15-day plan, a checkpoint, activities, labs, and rubrics. In addition to the CCSS & NGSS standards listed, it covers ISTE standards: 1.2.a, 1.2.c, 1.3.a-d, 1.4.a-d, 1.5.a-d, 1.6.b-d, 1.7.a-d. This is a very thorough unit on Ecosystems and the use of technology to collect data. As
Grades:
6th - 8th
Types:
NGSS:
MS-LS2-2
, MS-LS2-3
, MS-LS2-5
, MS-LS2-4
, MS-LS2-1
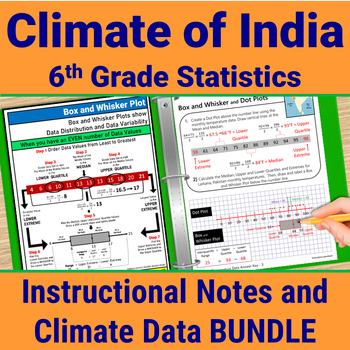
India Geography 6th Grade Statistics Mean Median Mode Range Box Plot Activity
Enrich your study of India using 6th Grade stats skills to analyze India climate data. Master Data Display with Box and Whisker Plots, Histograms, Dot Plots, Stem and Leaf Charts. Calculate Measures of Central Tendency (mean, median, mode, range) and Mean Absolute Deviation. Write Statistical Questions. Analyze Data Distribution and Data Variability.All with climate data (temperature and precipitation) from ancient Indian sites!This Print and Go STEM/STEAM PBL resource includes 120 pages of Inst
Subjects:
Grades:
6th - 8th
NGSS:
MS-ESS2-6
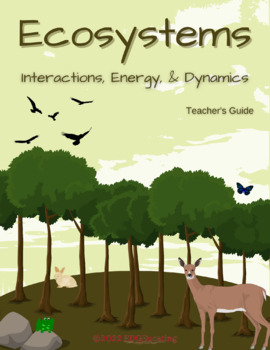
Ecosystems: Teacher's Guide for Middle School
Science addresses questions about the natural and material world. In this unit, we will be exploring these connections in more depth. We will examine how forces interact with and disrupt nature. This unit includes a 15-day plan, a checkpoint, activities, labs, and rubrics. In addition to the CCSS & NGSS standards listed, it covers ISTE standards: 1.2.a, 1.2.c, 1.3.a-d, 1.4.a-d, 1.5.a-d, 1.6.b-d, 1.7.a-d. This is a very thorough unit on Ecosystems and the use of technology to collect dat
Grades:
6th - 8th
Types:
NGSS:
MS-LS2-2
, MS-LS2-3
, MS-LS2-5
, MS-LS2-4
, MS-LS2-1
Also included in: Ecosystems Middle School Unit
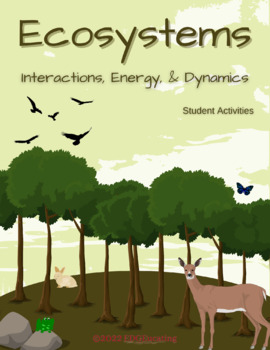
Ecosystems: Student Activities for Middle School
Science addresses questions about the natural and material world. These activities explore these connections in more depth. Students will examine how forces interact with and disrupt nature. There are 5 activities that cover 11 days of work. The activities include research, writing, a lab, digital presentation, and data collection. In addition to the CCSS & NGSS standards listed, it covers ISTE standards: 1.2.a, 1.2.c, 1.3.a-d, 1.4.a-d, 1.5.a-d, 1.6.b-d, 1.7.a-d. This is a varied set of act
Grades:
6th - 8th
Types:
NGSS:
MS-LS2-2
, MS-LS2-3
, MS-LS2-5
, MS-LS2-4
, MS-LS2-1
Also included in: Ecosystems Middle School Unit
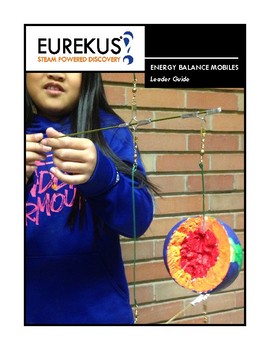
Energy Balance Mobiles - Leader Guide (PDF)
STEAM PROJECT – Energy & Economic Data Energy Balance Mobiles is a robust learning program for exploring energy and economic data through kinetic sculpture. Students investigate global energy production and consumption patterns while researching resources and statistical data.They explore renewable and non-renewable energy sectors and embark upon a collaborative journey that encourages creativity, learner-led inquiry and community. Working in small groups, learners analyze energy data from d
Subjects:
Grades:
5th - 8th
Types:
Excel Graphing Temperature Comparison
What's the temperature like in YOUR town? Does your curriculum include a study of weather factors? This Temperature Comparison Excel double-bar graph project can be an engagingway to:* integrate technology, math, science, and geography* introduce, extend, or enrich a math, social studies, or science topic of study* introduce or practice creating sheets and charts using Excel* give students a chance to make connections across the content areasThis classroom-tested project file includes: * student
Grades:
4th - 6th
Types:
NGSS:
5-ESS1-2
, 3-ESS2-1
, 3-ESS2-2
, 5-ESS2-1
, MS-ESS2-6
...
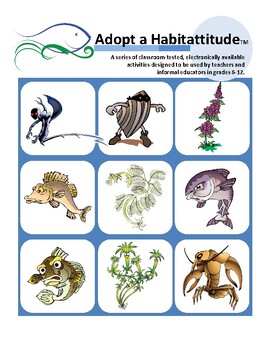
Adopt a Habitattitude
Adopt a Habitattitude(TM) is a series of classroom-tested, electronically available activities designed to be used by teachers and informal educators in grades 6-12. These innovative and engaging activities can help students learn about and prevent the spread of aquatic invasive species (AIS). In order to protect and sustain our water bodies for future generations, youth—our future decision makers and leaders—need to acquire relevant knowledge about AIS to become effective and responsible decisi
Subjects:
Grades:
6th - 12th
NGSS:
MS-LS1-5
, MS-LS2-2
, MS-LS2-3
, MS-LS2-5
, MS-LS2-4
...
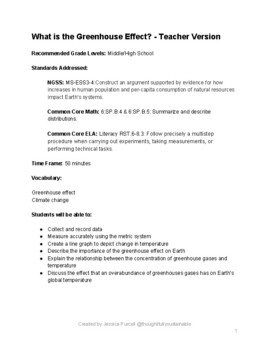
What is the Greenhouse Effect?
This science experiment is a terrific way to visualize the greenhouse gas effect and begin discussions about human-induced climate change. Complete with both teacher and student versions, this lesson can be used as a demonstration or as a group experiment, based on your needs. A Spanish version of this experiment is also available in my store!
Subjects:
Grades:
6th - 12th
Types:
NGSS:
MS-ESS3-4
, MS-ESS3-3
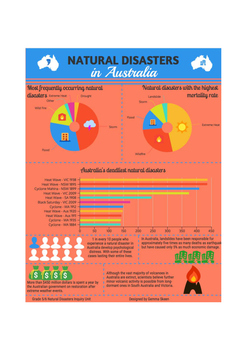
Natural Disasters in Australia Infographic
This infographic shows information about natural disasters in Australia. It can be used to accompany inquiry or science units about natural disasters or to interpret data.
Subjects:
Grades:
4th - 6th
Types:
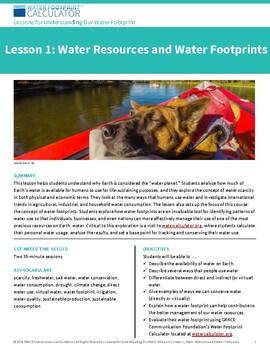
Middle School — Lesson 1: Water Resources and Water Footprints
This lesson gives students an in-depth understanding of key water issues. They learn about water resources and water footprints, then use the Water Footprint Calculator to analyze their direct and virtual water consumption. Students get a foundation of knowledge and learn why they should care about protecting water resources, which makes it easier for them to make a fundamental shift in attitude about their water use. Designed for middle school – lower secondary level, ages 11 to 14 – the lesson
Subjects:
Grades:
5th - 8th
Types:
NGSS:
MS-ESS2-3
, MS-ESS2-2
, MS-ESS3-5
, MS-ESS3-4
, MS-ESS2-4
...
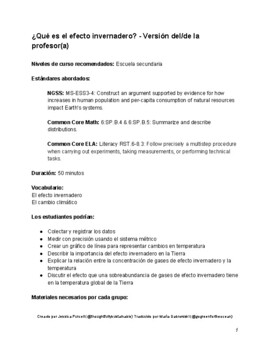
¿Qué es el efecto invernadero? (What is the Greenhouse Effect?)
This is a terrific way to visualize the greenhouse gas effect and begin discussions about human-induced climate change. Both teacher and student versions of this lesson are written in Spanish. For an English version of this lesson, please visit my store!
Subjects:
Grades:
6th - 12th
Types:
NGSS:
MS-ESS3-4
, MS-ESS3-3
Showing 1-21 of 21 results

