4,090 results
Statistics activity pdfs
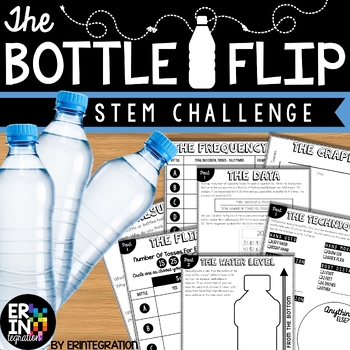
Water Bottle Flip STEM Challenge + STEM Activity
The ORIGINAL water bottle flip STEM activity and lab! Water bottle flip at school? Absolutely! Students will love this on-trend STEM challenge inspired by the popular YouTube water bottle flipping challenge where students toss a water bottle and attempt to land it straight up. Practice scientific method with some probability, fractions and data collection in the mix while having fun!This self-paced, low-prep, project based learning water bottle flip STEM challenge is print-and-go. Each activit
Subjects:
Grades:
3rd - 6th
Types:
CCSS:
NGSS:
K-2-ETS1-2
, K-2-ETS1-3
, MS-ETS1-2
, K-2-ETS1-1
, 3-5-ETS1-3
...
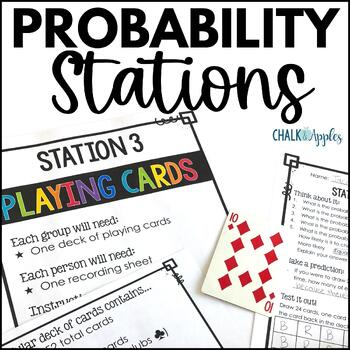
Chance & Probability Activities: Hands-On Theoretical & Experimental Probability
Make teaching probability exciting with these hands-on fun probability activities! This set includes 6 low-prep chance and probability stations perfect for exploring theoretical and experimental probability and critical thinking. Quick and easy setup plus clear student directions make these activities perfect for centers or substitute days, too!Lead your students to discover concepts of probability by exploring it on their own before teaching probability rules. Students will love exploring proba
Subjects:
Grades:
5th - 7th
Types:
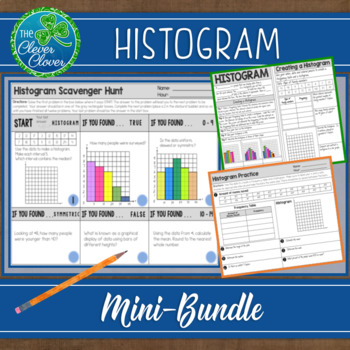
Histogram - Notes, Practice Worksheets and Scavenger Hunt
This histogram resource includes guided notes, a practice worksheet and a scavenger hunt. Your students will have the opportunity to create, interpret and discuss histograms. Below, you will find a detailed description of the notes, worksheet and scavenger hunt. Guided NotesThere are two small pages of guided notes. The first page provides the definition of a histogram and step by step instructions on how to create a histogram. The bottom portion of the notes has students examine three types (un
Subjects:
Grades:
6th - 9th, Adult Education
CCSS:
Also included in: Statistics Bundle - Guided Notes, Worksheets & Scavenger Hunts!
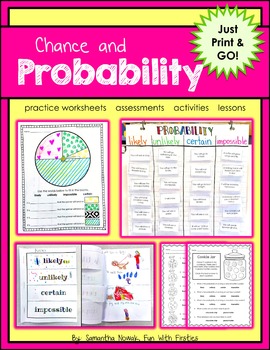
Probability: Print & Go! worksheets, activities, lessons, and assessments
*UPDATED! The file has been updated to include options for different terminology (i.e. the original "likely, unlikely, certain & impossible" terms are still included but options to use "impossible, possible, & certain" are now included as well).These probability printables are sure to help your kiddies get a better grasp on the sometimes difficult concept of probability and likelihood. Key math words (likely, unlikely, certain, and impossible) are used consistently throughout this pack t
Subjects:
Grades:
K - 2nd
Types:
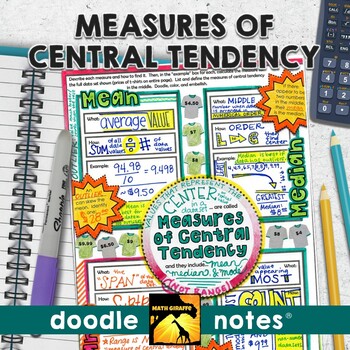
Measures of Central Tendency Doodle Notes (Mean, Median, Mode, & Range)
Mean, Median, Mode, and Range (Measures of Central Tendency): "doodle notes" - visual note taking pages with interactive tasks for building stronger retention of measures of center (mean, median, mode, and range) for your middle school statistics unit in Pre-AlgebraBoost your students' focus and memory! The blend of graphic and linguistic input in these guided visual notes helps students' brains to convert the information to long-term memory more easily.When students color or doodle in math clas
Subjects:
Grades:
6th - 8th
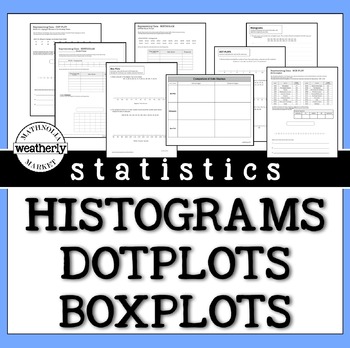
STATISTICS - Histograms, Dot Plots and Box Plots
There is no need to scour the internet for data. This resource includes the data and the format to challenge your students' skills with data displays.This packet includes worksheets that provide opportunities for students to create histograms, dot plots, and box plots.They can be used as guided practice or as "on your own" activities.INCLUDES3 worksheets with realistic data.3 worksheets with REAL data (Apple stock prices, US Olympic athlete ages, and the Oscars:Best Picture/ Movie Times)AND 3 wo
Subjects:
Grades:
6th - 9th
Types:
CCSS:
Probability Activities MEGA Pack of Math Worksheets and Probability Games
Probability Activities MEGA Pack of Math Worksheets and Probability Games - Over 50 pages of math stations, worksheets, activities, and visuals to teach young learners about probability in fun, hands-on ways!
This packet includes:
- 10 probability vocabulary classroom posters
- 12 various probability worksheets
- 7 hands-on math stations
CHECK OUT THE FREE PREVIEW! Click "Download Preview" under the price :)
This pack is jam-packed! It's really hard to find quality probability worksheets and
Subjects:
Grades:
K - 3rd
Types:
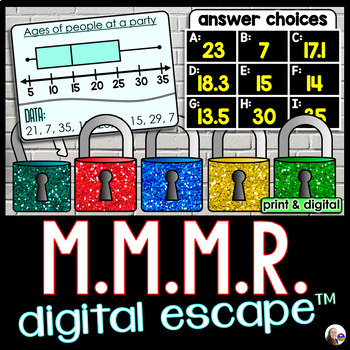
Mean Median Mode and Range Digital Math Escape Room Activity
An engaging math escape room for reviewing measures of central tendency. Students must unlock 5 locks by finding mean, median, mode and range in 5 sets of data. Questions are grouped 4 per puzzle, resulting in five 4-letter codes that will unlock all 5 locks.Data is presented in:stem and leaf plot, raw data set, box and whiskers plot, tabledot plot. The entire activity is housed in one GOOGLE Form. There are no links to outside websites. The 4-letter codes are set with answer validation so that
Subjects:
Grades:
6th - 8th
Types:
Also included in: Middle School Math Digital Activities Bundle
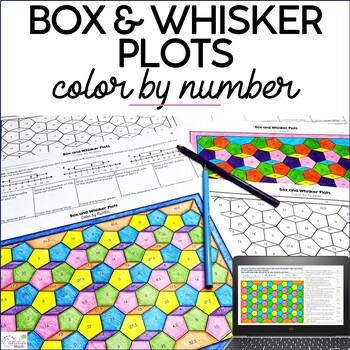
Box and Whisker Plots Color by Number Activity 6th Grade Math Coloring Pages
This box and whisker plots color by number activity includes two print and one digital version, offering engaging and versatile practice, while adding the mindfulness, wellness, and quietness coloring brings.Coloring in math has been shown to help reluctant students feel more comfortable with math:-)The box and whisker plot problems require students to identify:First quartile MedianThird quartile Interquartile rangeRange MinimumMaximum Number that would be in each quartile, based on a number of
Subjects:
Grades:
6th - 7th
Types:
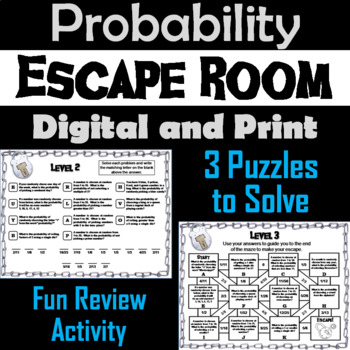
Simple Probability Activity: Escape Room Math Breakout Game
This breakout escape room is a fun way for students to test their skills with probability. Important: (How to Make Completely Digital)This product normally requires the printing of the questions to accompany a digital form for students to input answers. But if you follow a couple simple steps, this can be made entirely digital! Just use the following tool:https://smallpdf.com/split-pdf(choose "extract pages")to extract the pages containing the questions into its own PDF. You can then upload t
Subjects:
Grades:
4th - 6th
Types:
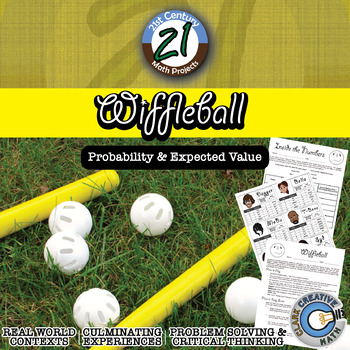
Wiffleball -- Theoretical & Experimental Probability - 21st Century Math Project
Theoretical and Experimental Probability gets a 21st Century Math Project facelift in this interactive game. Tired of flipping coins and spinning spinners? Students play the role of team managers and with only player statistics they must build a team capable of winning the championship. Students will plays a series of Wiffleball games where they will keep track of statistics using a baseball/softball inspired scorebook and after the game crunch the number to see if their players performed up to
Subjects:
Grades:
6th - 12th
Types:
Also included in: Probability & Expected Value Unit Bundle - Distance Learning Compatible
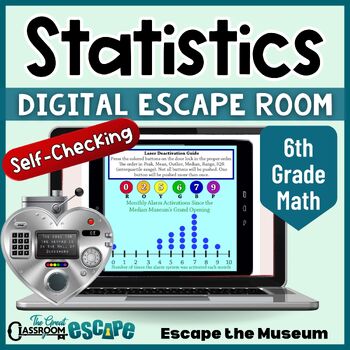
6th Grade Math Data Analysis & Statistics Activity Digital Escape Room Game
Find the median, read the box plot, interpret the frequency table, and unlock the door! This 6th grade math activity based on statistics and probability standards will put your students statistical skills to the test. Your students are volunteer docents at the Median Museum. After the security system locks everyone in, they will need to use their knowledge of statistics to escape the museum. This engaging digital escape room is easy for teachers to implement. The breakout process is fully autom
Subjects:
Grades:
6th - 7th
Types:
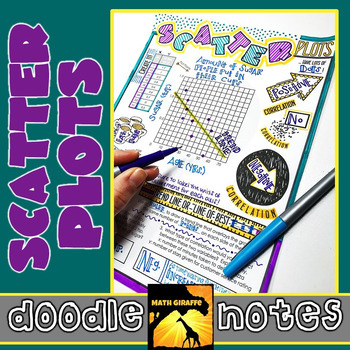
Scatter Plots Doodle Notes
Creating & Analyzing Scatter Plots - Visual Interactive "Doodle Notes"
When students color or doodle in math class, it activates both hemispheres of the brain at the same time. There are proven benefits of this cross-lateral brain activity:
- new learning
- relaxation (less math anxiety)
- visual connections
- better memory & retention of the content!
Students fill in the sheets, answer the questions, and color, doodle or embellish. Then, they can use it as a study guide later on.
C
Subjects:
Grades:
7th - 8th
CCSS:
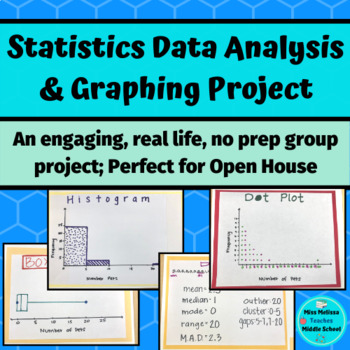
Statistics Project: Data Analysis & Graphing- real life, no prep
This statistics project is intended as a closure for your sixth grade statistics unit and aligns with ALL of the sixth grade statistics and probability common core state standards. In groups, students work together to choose a statistical question to ask the class. Once the class is surveyed, the group works together to create a frequency table, a dot plot, a histogram, and a box and whiskers plot. After creating their graphs, the groups analyze their data by looking at the mean, median, mode ra
Subjects:
Grades:
6th - 7th
Types:
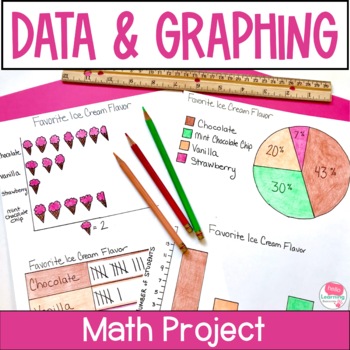
Data and Graphing Project - Real World Math Project Based Learning Activities
This data and graphing project gives your students a meaningful way to apply their data and graphing skills. Use this real world math project as an end of unit activity, enrichment activity or assessment. Easy to use and fun for students!Click the PREVIEW button above to see everything that is included in this fun math project!⭐ This resource includes:teacher information, directions and sample schedulesupply listgrading rubricstudent direction sheettwo data collection sheets (one for open ended
Subjects:
Grades:
4th - 6th
Types:
CCSS:
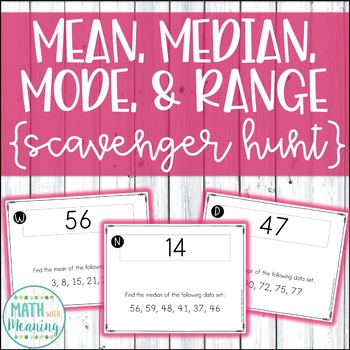
Mean, Median, Mode, and Range Scavenger Hunt Activity - CCSS 6.SP.B.5.C
Make practicing finding mean, median, mode, and range fun! This self-checking activity will allow students to get out of their seats and move around the classroom as they solve 16 problems. Each problem solved will lead the students to a new problem to solve until they have solved all 16 problems. You will be amazed at the math talk you hear and the collaboration between students as they work on this activity!Each data set includes 4-8 numbers. The answer to each problem is a whole number. There
Subjects:
Grades:
5th - 8th
Types:
CCSS:
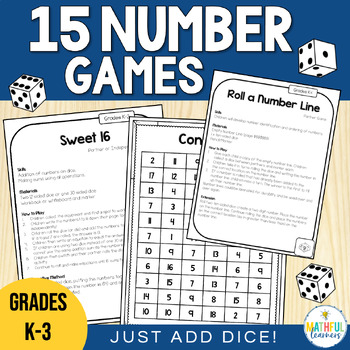
Dice Math Games - 15 Printable Number Centres - K to 3
Playing these Dice Number Games will keep your students engaged and eager to learn more during your next math centers. Including 15 number games, these printable dice games can easily be used as your warm up activity or as a complete math lesson. Your students will practice basic math skills all while having FUN. Most games can be played over and over again in your Grade K-3 classroom! All resources are provided, simply read and copy off game boards as required, and JUST ADD DICE! In search of
Subjects:
Grades:
K - 3rd
Types:
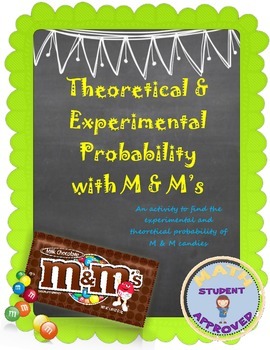
Theoretical and Experimental Probability M&M activity
Students need to find the probability of picking certain colored M&Ms, and asked to change them into decimals, fractions, and percents. They are asked to draw specific M&Ms at random for experimental probability problems. They are asked to make a few predictions, as well. This is a lengthy lesson and takes a while to get through, so make sure you have enough time to get through it. It can be done in 2 days, and if you need to use colored chips or counters instead, go for it!
Subjects:
Grades:
5th - 11th
Types:
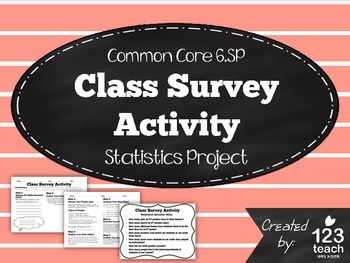
Class Survey Activity - Common Core 6th Grade Statistics Project
This "Class Survey Activity" includes a two page activity aligned to common core standards for statistics and probability (6.SP).
Students will have to come up with a statistical question to survey their classmates. Then, the students will record their results, create a graph, and analyze their data. Lastly, the students will present their results with the class. With my class, I give the students at least a full class period to complete the activity, and then it takes another class perio
Subjects:
Grades:
5th - 7th
Types:
Also included in: Math Assessments and Review Activities BUNDLE for 6th Grade Common Core
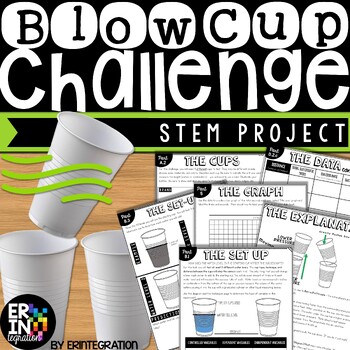
Blow Cup STEM Challenge and Scientific Method Project
The Blow Cup Challenge is now a STEM activity with this engaging science project inspired by the viral video where students try to blow one cup into another cup. Great low-prep way to teach the scientific method, variables and review math skills!This self-paced, multi-part Blow Cup STEM challenge is print-and-go. Each activity sheet guides students through the project. STEM Challenge Overview:Students will use the included visual directions, graphic organizers, charts, and activities to...Deter
Subjects:
Grades:
3rd - 6th
Types:
NGSS:
MS-PS2-2
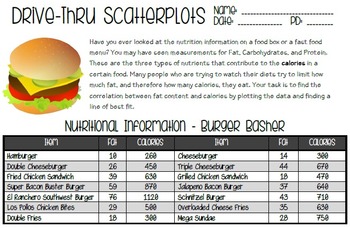
Drivethru Scatter Plots - Line of Best Fit Activity
This activity is a fun way to work with scatter plots in a realistic situation. Students will compare the fat and calories in items from a fictional fast food restaurant by creating a scatter plot. They will also draw a line of best fit, approximate the slope of that line, and make predictions based on the line.
Included:
*Drive-Thru Scatterplots Activity
*Answer Key
Please leave feedback with any suggestions for improvements! :)
Subjects:
Grades:
8th - 9th
Types:
Two Way Relative Frequency Tables Worksheet
Are you a math teacher looking for engaging classwork or homework activities to help your students with relative frequency tables? Look no further! Our worksheet on completing two-way tables and creating relative frequency tables is perfect for your needs. Great for Pre-Algebra and Algebra 1 students. With real-world situations and comprehension questions based on relative frequency tables, students will learn to summarize and interpret data collected from the same subjects. They'll construct an
Subjects:
Grades:
8th - 9th
Types:
CCSS:
Also included in: Scatterplots Two Way Tables and Residual Plots Worksheets Bundle
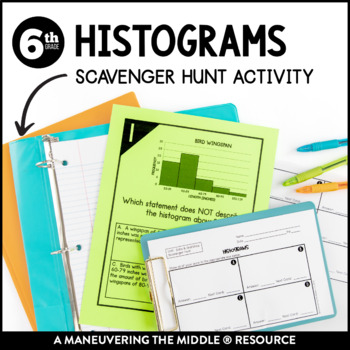
Histograms Scavenger Hunt | Interpreting Histograms Activity
This Histograms Scavenger Hunt consists of 10 clue cards where students must use the clue to interpret histograms. This activity focuses on analyzing histograms and determining which statements are represented in the histogram. This activity is great for in class practice! Students can get out of their seats and move around, while still applying their understanding of data and statistics. Students are able to practice and apply concepts with this histograms activity, while collaborating and havi
Subjects:
Grades:
5th - 7th
Types:
Correlation vs Causation Worksheet
Hello Math Teachers! Help your math students understand the difference between correlation and causation with our fun activity worksheet. Students will evaluate 42 statements and determine whether they demonstrate correlation or causation, and there are some multiple-choice questions as well. This activity also includes a puzzle that generates an answer, making it easy to grade.This two-sided worksheet is great for classwork or homework and is designed to help students develop critical thinking
Subjects:
Grades:
9th
Types:
CCSS:
Also included in: Algebra Math Riddle Worksheets
Showing 1-24 of 4,090 results


