39 results
Free high school algebra laboratories
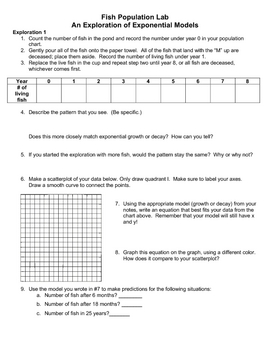
Population Lab: Exponential Growth and Decay
This lab is designed to give students a hands-on introduction to exponential growth and decay functions and their graphs.
Grades:
8th - 10th
Types:
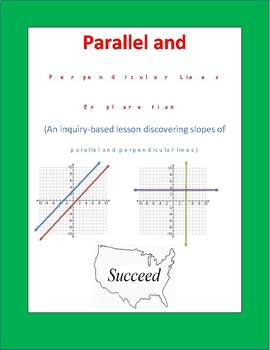
Slopes of Parallel and Perpendicular Lines: An Inquiry-Based Exploration
This is an inquiry-based learning activity used to teach students of the properties of the slopes of parallel lines and the slopes of perpendicular lines. This activity is best used before going too in-depth with the algebraic properties of parallel and perpendicular lines as it allows students to discover, on their own terms, these properties. The papers are arranged so that you may print the graphing activities on one sheet of paper and the questions on another. Have students put papers side b
Subjects:
Grades:
7th - 9th
Types:
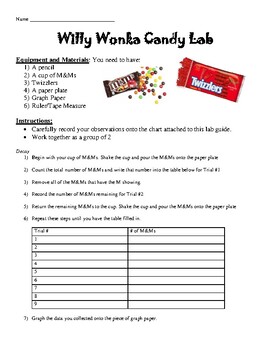
Willy Wonka Candy Lab - Exponential Growth and Decay
In this candy lab, we will be using M&M's to discover exponential growth and decay relationships. It is set up as a lab activity, so students should be able to complete this on their own. We also use Twizzlers so show an exponential decay in this lab.
Subjects:
Grades:
9th - 10th
Types:
CCSS:
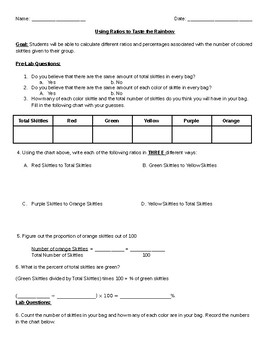
Skittles Proportion Activity
Students are to be provided a bag of skittles. They are going to use proportions and ratios to determine if there are the same number/ratio of each color in all different sized bags.
I had students work in groups of 2 for this activity. Within the activity I broke it up into three different sections; a pre-lab, lab, and post-lab portion. Students make initial guesses/hypothesis, test out their theory, use proportions and ratios to analyze their results and graph data.
Subjects:
Grades:
4th - 9th
Types:
Exploring Graphs of Absolute Value Functions
Students work together with a graphing calculator to explore how to graph absolute value functions. My students go through this exploration packet before I have them take formal notes on absolute value graphing. If you have technology available, desmos.com is a great graphing calculator for this project.
Subjects:
Grades:
9th
Types:
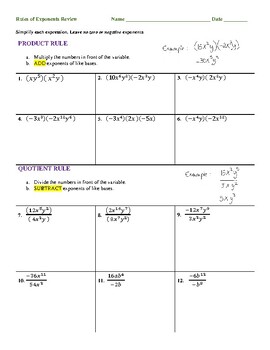
Rules of Exponents Review (Laws of Exponents)
Applying rules of exponents can be challenging for many students. This 3 page packet includes six sections, one for each rule below:1) Product Rule 2) Quotient Rule3) Power of a Product or a Quotient4) Power of a Power5) Zero Exponents6) Negative ExponentsEach section includes directions on how to simplify expressions and examples for each rule. This worksheet is meant to help struggling students get the right answers. It is meant to be used as a practice and not a lesson. Following an unconvent
Subjects:
Grades:
8th - 9th
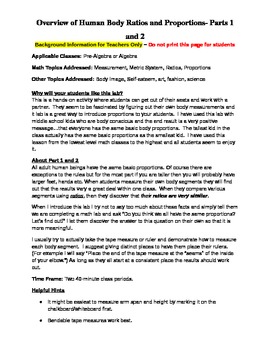
Human Body Proportions Lab Overview (To be used with my lab worksheet.)
This detailed lesson overview guides you through my other Human Body Proportions Lab that is available on TPT. This is one of my personal favorites of the entire teaching year! I have spent several years perfecting it and condensing it into a manageable lesson. Enjoy!Why will your students like this lab?This is a hands-on activity where students can get out of their seats and work with a partner. They seem to be fascinated by figuring out their own body measurements and it lab is a great way
Subjects:
Grades:
6th - 10th
Types:
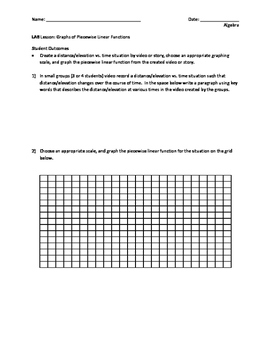
Graphs of Piecewise Linear Functions in the Real World
This activity is a "Lab" series lesson activity designed to supplement and enhance student learning after teacher instruction.
In this "Lab" students work in small groups to video, demonstrate, or create a story that demonstrates distance or elevation versus time. The students will then take this information to create a graph and answer follow up questions based on their scenario and graph.
While this "Lab" can supplement any teacher instruction based on this topic, this "Lab" was developed
Subjects:
Grades:
9th - 11th
Types:
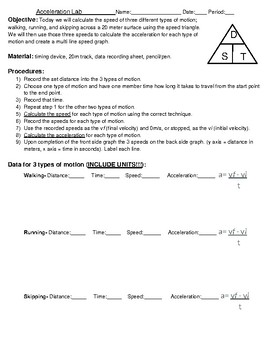
Acceleration lab - NGSS
In this lab students will calculate the speed of three different types of motion; walking, running, and skipping across a 20 meter surface using the speed triangle. They will then use those three speeds to calculate the acceleration for each type of motion and create a multi line speed graph.
Subjects:
Grades:
9th
CCSS:
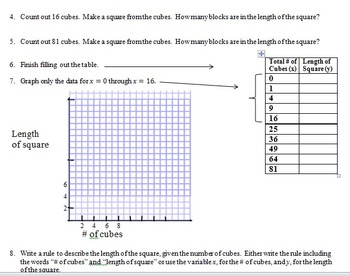
Hands-On Understanding of Square Roots: Cubes & Making Squares
This simple, hands-on activity has students count out a given number of unit cubes and then asks them to build a square from the cubes. Then, they record the length of the square. Students repeat this process with different numbers of cubes and record the information in a graph and a table. They also are asked to write a rule to describe the relationship between the number of cubes and the length of the square.
I've found that this activity helps students better understand the idea of the sq
Subjects:
Grades:
8th - 10th
Types:
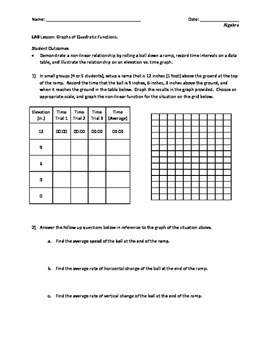
Graphs of Quadratic Functions in the Real World
This activity is a "Lab" series lesson activity designed to supplement and enhance student learning after teacher instruction.
In this "Lab" students work in small groups to experiment with a ball rolling down a ramp. It allows the students to work with a set of data that is believed to be linear, but is really quadratic when graphed on the coordinate plane.
**It is important to note that the teacher will need additional supplies such as a ramp (longer the better), a ball, and a timing de
Subjects:
Grades:
9th - 11th
Types:
Stacking Cups - apply linear functions without even knowing it!
The question is simple: how many cups does it take to make a stack as tall as your teacher? By striving to answer this question, students develop an intuition for rate of change, initial value, and solving linear functions.Get to know Stacking Cups⭐ Student-driven discovery⭐ Perfect for groups⭐ Highly accessible⭐ Online-learning friendly⭐ Layered complexity for just the right challenge Love Stacking Cups? Follow it up with Stacking Cups Analysis for a multi-day authentic learning experience desi
Subjects:
Grades:
7th - 10th
Types:
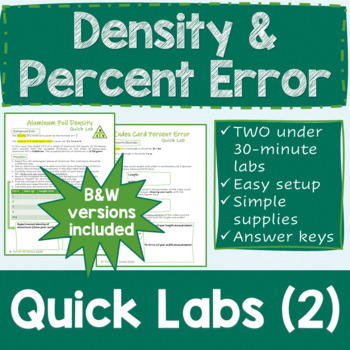
Density & Percent Error Quick Labs
Enjoy using these 2 quick labs to practice measurement skills, density calculations, and percent error any time throughout the year. In the density lab, students are asked to determine the density of aluminum by measuring the dimensions and mass of sheets of aluminum foil. In the index card lab, students calculate the area and perimeter of an index card, and determine their percent error based on the provided dimensions. Color and B&W versions included.These are considered quick labs because
Subjects:
Grades:
7th - 10th
Types:
Thanksgiving Multi-Step Equations Lab Activity
Your students will love this multi-step equations lab activity! It is so much fun. With my students, I took them to the gym but this can be done within a regular classroom (depending on size of room and number of students). I have included integers, decimals, and fractions!
Subjects:
Grades:
6th - 9th
Types:
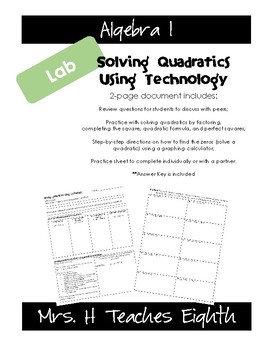
Solving Quadratics using Technology
Two-page document includes: review questions for students to discuss with peers; practice with solving quadratics by factoring, completing the square, quadratic formula, and perfect squares; step-by-step directions on how to find the zeros (solve a quadratic) using a graphing calculator; and a practice sheet to complete individually or with a partner.
Grades:
8th - 9th
Types:
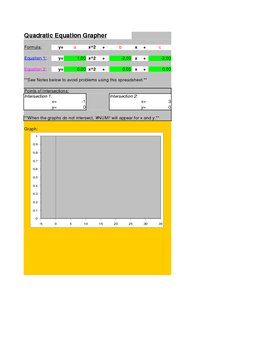
Quadratic Grapher
Quadratic Grapher MS Excel Spreadsheet graphs up to 2 quadratic equations / functions at a time. It is color coded so it is easy to see which parabola corresponds to which equation.
It also displays 10 points. The x values can be changed to your liking.
It also finds the points of intersection between the two parabolas. This is useful for solving a system of two quadratic equations. It could probably even solve a system of two equations that has one quadratic and linear equation. Just inp
Grades:
9th - 12th, Higher Education
Types:
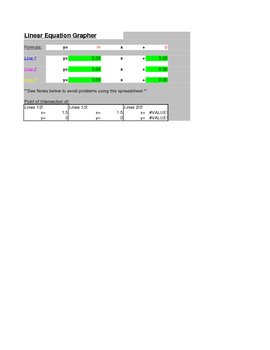
Linear Grapher
Linear Grapher Microsoft Excel Spreadsheet that allows you to graph up to 3 lines at a time. The lines are color coded with the equations, so you will know which line corresponds to which equation.
It also displays 10 points for each equation. The x values for these points can be adjusted.
It also finds the points of intersection for every pair of lines. This is helpful for system of equations.
It also has a seperate application built into the spreadsheet for finding the equation of a line
Grades:
8th - 12th, Higher Education
Types:
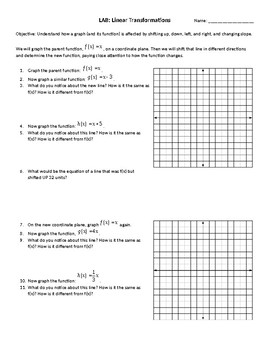
LAB: Linear Transformations
Students explore how a linear function changes (both graphically and algebraically) through observation. I highly recommend working through the first example as a class - or a similar example. But the best discussions happen when students work in groups and collaborate their hypotheses and conclusions.Feel free to make edits to adapt it to your needs! And as always, I would appreciate any feedback or ways to improve the lesson. Thank you!
Grades:
6th - 12th
Types:
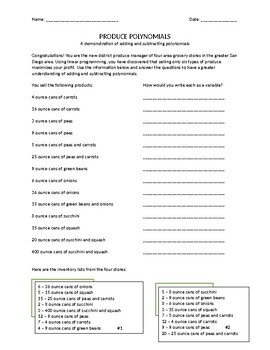
Produce Polynomials
Use a real life application of tracking the inventory of grocery stores to learn the concept of adding and subtracting polynomials. Includes a worksheet and answer key.
Subjects:
Grades:
8th - 12th
Types:
CCSS:
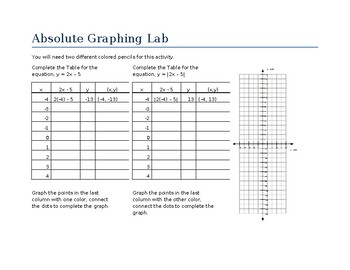
Absolute Value Graphing Lab
In this quick introductory lab, students will develop an understanding about the shape and properties of absolute value graphs by comparing contrasting similar linear and absolute value functions. Key included!
Subjects:
Grades:
7th - 12th
Types:
CCSS:
The Plumbing Problem:The Algebra Lab Manual
Maybe you are looking for an activity or lesson to give to your class before a long vacation or holiday. What about demonstrating an application of a concept just recently covered. Each Algebra Lab Manual exercise the student will be able to see the everyday application of mathematics and data analysis. The student will be able to formulate conclusions with understanding after completing each activity and provide detailed explanations for their solutions. As an option the use of spreadsheet soft
Subjects:
Grades:
7th - 11th, Adult Education
Types:
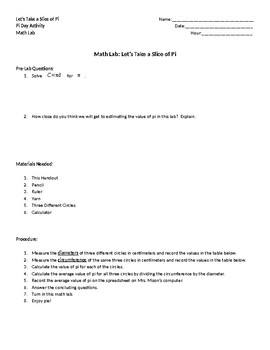
Pi Day Math Lab
This Pi Day Math Lab asks students to measure several circular objects to estimate the value of pi.
Subjects:
Grades:
7th - 12th
Types:
Summative Lab Task - Electrical Circuit Design
A lab project, suitable for individual work or work in teams of two. The students are given the task of designing a circuit that controls lights or lamps that represent different components of a spacecraft. The students must be able to control either individual lamps, or a combination thereof, with a set of switches.
After the circuit has been designed, students are to be given a lab period to build the circuit they designed the previous day. Students will be required to demonstrate the use of
Grades:
11th - 12th

Electronic Student Grapher
The electronic student grapher is a simple program that can be used to demonstrate graphing linear lines and inequalities. This also can be used to allow students explore and demonstrate their ability to create graphs.
Subjects:
Grades:
7th - 12th
Types:
Showing 1-24 of 39 results


