652 results
Common Core 8.SP.A.1 resources under $5
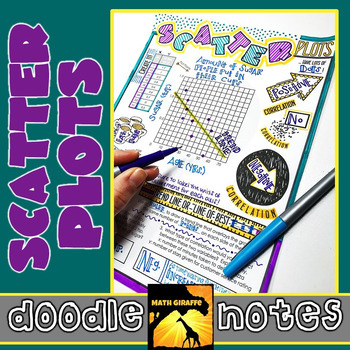
Scatter Plots Doodle Notes
Creating & Analyzing Scatter Plots - Visual Interactive "Doodle Notes"
When students color or doodle in math class, it activates both hemispheres of the brain at the same time. There are proven benefits of this cross-lateral brain activity:
- new learning
- relaxation (less math anxiety)
- visual connections
- better memory & retention of the content!
Students fill in the sheets, answer the questions, and color, doodle or embellish. Then, they can use it as a study guide later on.
C
Subjects:
Grades:
7th - 8th
CCSS:
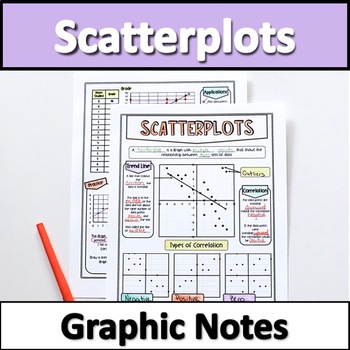
Scatter Plots Graphic Notes
Looking for an engaging way to teach scatter plots? These graphic notes are perfect for student engagement and can double as classroom posters!These content rich, beautiful notes serve as a great introduction to your unit and work wonderfully as a quick-reference for students. Material Covered: trend lines/line of best fit, outliers, types of correlation (positive, negative, zero), creating & interpreting scatter plots and trend lines. This Product Includes1 Page of Key Features Scatter P
Grades:
8th
Types:
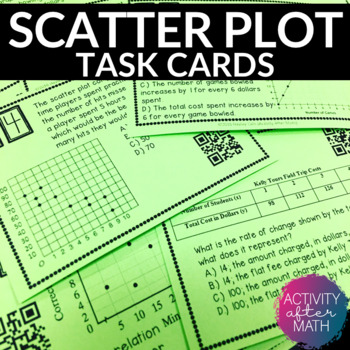
Scatter Plots and Line of Best Fit Task Cards with QR Codes
Get your students involved with practicing Interpreting Data with Scatter Plots and Line of Best Fit! Task cards include multiple choice problems and constructed response. Click here to SAVE and get this as a Task Cards BUNDLEThis resource includes:Teacher InstructionsTeacher TipsStudent Instructions24 Task cards with QR codes24 Task cards without QR codesBlank Answer Document for studentsAnswer Key for easy gradingOptions for using this resource:You can print the ones with QR codes for students
Subjects:
Grades:
8th - 9th
Types:
Also included in: 8th Grade MATH TASK CARDS BUNDLE
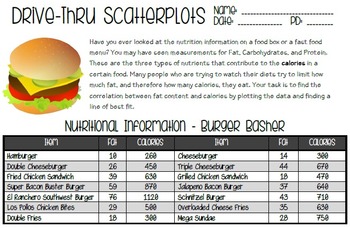
Drivethru Scatter Plots - Line of Best Fit Activity
This activity is a fun way to work with scatter plots in a realistic situation. Students will compare the fat and calories in items from a fictional fast food restaurant by creating a scatter plot. They will also draw a line of best fit, approximate the slope of that line, and make predictions based on the line.
Included:
*Drive-Thru Scatterplots Activity
*Answer Key
Please leave feedback with any suggestions for improvements! :)
Subjects:
Grades:
8th - 9th
Types:
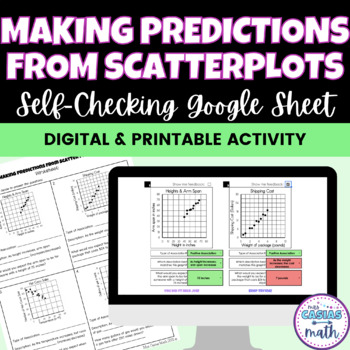
Making Predictions from Scatter Plots Activity - Digital & Worksheet
Students love the instant feedback of this self-checking making predictions from scatter plots activity! Students can draw a trend line on the paper worksheet version, or visualize it/hold up a pencil to the computer screen for the digital version. This product includes a google sheet version and a worksheet version with the same scatter plots & questions. There are 9 linear scatter plots with 3 questions each. The questions are what is the type of association, match a description to the gra
Grades:
8th
Types:
Also included in: 8th Grade Math Pre Algebra Digital and Printable Activities MEGA BUNDLE

8th Grade Math End of Year Review Digital Escape Room Activity
This virtual escape challenge is intended for reviewing 8th grade math common core standards around the end of the year. This digital problem solving review lesson would be a great resource for test prep but will also provide challenge, enriched math conversation, and fun. This breakout game will allow students to practice 8th grade math common core standards. If you are concerned that your students will rush through the breakout without solving the problems thoroughly, print the scratch paper t
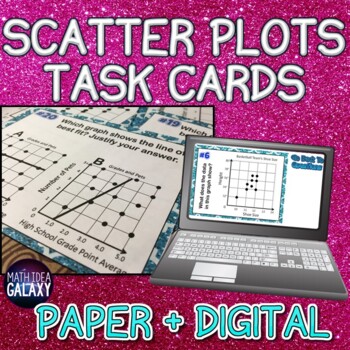
Scatter Plots Task Cards- Printable & Digital Resource
This is an engaging activity for students to practice reading and interpreting scatterplot graphs. Students will practice scatter plots in a variety of ways; these task cards can be used as a game, a center or station, a whole class activity, independent work, or partner practice for concepts related to scatter plots and the line of best fit.These task cards come in both printable AND digital formats. The digital format is built in Google Slides to easily assign to students, and includes answers
Subjects:
Grades:
6th - 8th
Types:
CCSS:
Also included in: Scatter Plots Activity Bundle
⭐8th Grade Math End of Year Review Escape Room⭐
PDF AND GOOGLE FORM INCLUDEDThis is a great way for students to work together and review their knowledge of all the skills learned in 8th Grade Math or great to use at the beginning of Algebra 1!There are a total of 5 tasks/puzzles included, one for each CCSS domain. TWO google forms links are included - one to use if you do not have google classroom and one if you would like to copy the form over into your own google drive. If you would rather use the digital version all you have to do is print
Subjects:
Grades:
8th - 9th
Also included in: 8th Grade Math Ultimate Curriculum and Activities Bundle
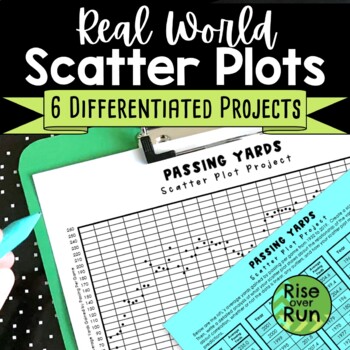
Scatter Plot Project with Real World Sports Data
Practice creating and analyzing scatter plots with these six differentiated real world projects. Students are provided statistics for a sport and must graph the data. Then, they write an analysis describing correlation, whether or not the data is linear, any outliers, and how the scatter plot might be used to make predictions. The scatterplots range from 38 points to 149 points, so they can be used to differentiate. The scatter plots will take a little time to plot, but they result in real
Subjects:
Grades:
8th - 9th
Types:
CCSS:
Also included in: 8th Grade Math Activities & Lessons Bundle for the Whole Year
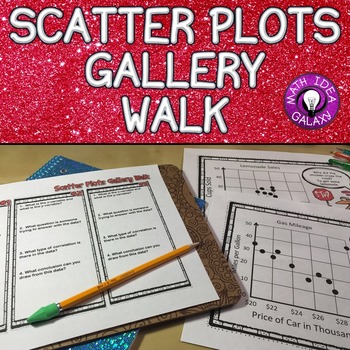
Scatter Plots Activity - Gallery Walk
This gallery walk will get your students engaged as they are practicing concepts related to scatter plots. This is a great partner activity and is so much better than a worksheet.
This resources includes:
-6 stations with 4 questions each
-Student record page
-Answer keys
Grades:
6th - 8th
Types:
CCSS:
Also included in: Scatter Plots Activity Bundle
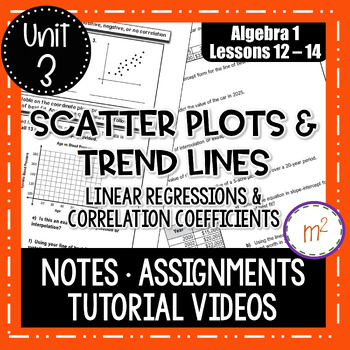
Scatter Plots and Trend Lines (Linear Regressions) - Algebra 1
Algebra 1 Notes and Assignments over Scatter Plots and Trend Lines. TUTORIAL VIDEOS included (no prep to you!) and can be found on my YouTube Channel: mandy’s math world - the videos are on the Linear Functions Unit Playlist! This product includes THREE days of lessons and assignments. Day 1 introduces scatter plots, positive/negative/no correlations, and making predictions by interpolating and extrapolating data. Students will identify general correlations, draw trend lines and make predictio
Subjects:
Grades:
8th - 11th
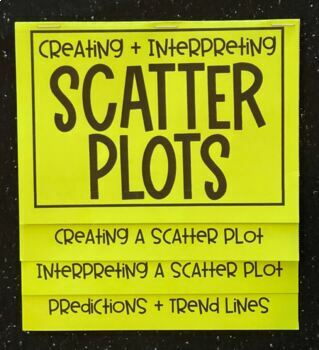
Scatter Plots Editable Foldable Notes for 8th Grade Math
This editable foldable serves as an overview or introduction to scatter plots. Inside, students will complete notes for the definition of scatter plot, cluster, outlier, and trend lines. They will construct a scatterplot from a table of values, identify clusters + outliers, draw a trend line, and write an equation (in slope-intercept form) for a trend line.I use this type of notes during guided instruction.This foldable is included in my: ★ 8th Grade Math/ Pre-Algebra Foldable + Activity Bundl
Subjects:
Grades:
8th - 9th
Also included in: Data Analysis and Statistics Foldable Bundle
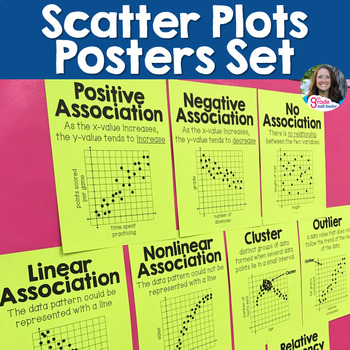
Scatter Plots and Two Way Tables Posters Set for 8th Grade Math Word Wall
Make the vocabulary visible and accessible for your students! This set of 12 printable vocabulary posters provides visuals and reminders for your students to reference during your Bivariate Data unit. Display these on your word wall while teaching scatter plots and two-way tables!The following vocabulary terms are included:scatter plotpositive association or positive correlationnegative association or negative correlationno association or no correlationlinear associationnonlinear associationoutl
Subjects:
Grades:
8th - 9th
Types:
CCSS:
Also included in: 8th Grade Math Vocabulary Posters for Word Wall - Full Year
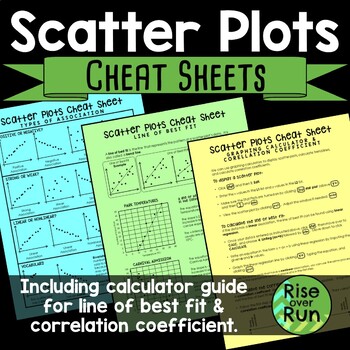
Scatter Plot Cheat Sheets Printable Guided Notes
Detailed sheets for the following topics: •Types of Association & VocabularyThis page shows examples of positive, negative, strong, weak, linear, and nonlinear association. It also shows clusters and outliers.•Line of Best FitThis page explains what a line of best is (or trend line) along with examples and nonexamples. It has 2 real world connections and how to interpret the line of best fit.•Graphing Calculator Guide & Correlation CoefficientThis sheet gives step by step instructions fo
Subjects:
Grades:
8th - 9th
CCSS:
Also included in: 8th Grade Math Activities & Lessons Bundle for the Whole Year
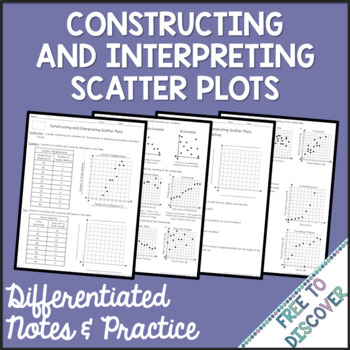
Scatter Plots Notes & Practice
These Constructing and Interpreting Scatter Plots notes and practice are differentiated based on some common needs found in the middle school math classroom. Modifications are considered for both struggling learners and high flyers. In these activities students practice constructing scatter plots given a table, identifying correlation, and describing the relationship between the two variables. Students will also consider trends that are not linear and identify and justify outliers.Differentia
Subjects:
Grades:
7th - 9th
CCSS:
Also included in: 8th Grade Math Curriculum Mega Bundle
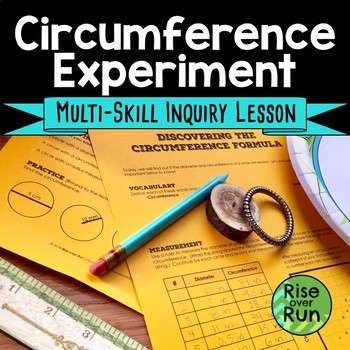
Pi Day Math Activity Circumference Discovery Lesson
In this inquiry lesson, students get to measure circles and discover the relationship between circumference and diameter! They measure circles in the classroom (or that they bring from home), graph a scatterplot, make connections, and discover the formula for a circle's circumference. The two-page handout guides student through the activity. It includes:vocabularymeasuring circles' diameters and circumferences with stringmaking a graphobservationsmaking predictions & improving solutionsp
Grades:
7th - 9th
Also included in: 7th Grade Math Discovery Lessons and Inquiry Activities Bundle
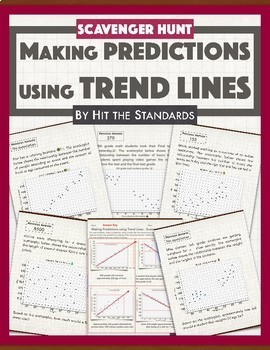
Predictions from Scatterplots using Trend Lines (best fit) -SCAVENGER HUNT
This Making Predictions using Trend Lines Scavenger Hunt is an excellent activity for students to practice working with scatter plots, lines of best fit, graphing, and the best part is that they get to move around the classroom looking for the next problem to solve! Directions: Print the 10 problems and scatter them around the room .Give one student worksheet to each student, place them in groups of 2 or 3 and assign a problem to each group. Students must make predictions for each problem using
Subjects:
Grades:
8th - 9th
Types:
Scatter Plots Escape Room
Do you love using Escape Room activities, but hate the prep? Or are you looking to implement an Escape Room for the first time, but aren’t sure where to start? Then look no further, this resource is low prep, highly engaging, and so easy to implement (even if it’s your first time). This escape includes a tech-free and technology version and requires no lockboxes or elaborate setups! Essentially, students will work through 5 levels of rigorous questions and along the way gather a 5-digit to unloc
Grades:
8th - 9th
Types:
Also included in: Escape Room Math Mega Bundle | Digital and Print
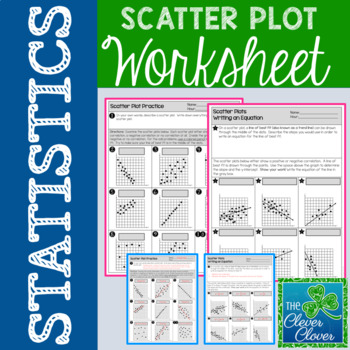
Scatter Plot Worksheet
Scatter Plot Worksheet
This resource allows students to explore scatterplots with a two page worksheet. Students are asked to define scatterplots in their own words. Nine questions ask students to identify the type of correlation (positive, negative or no correlation) that exists between two variables. Students are also asked to describe the steps used to write an equation for the line of best fit. Six additional questions require students to calculate the slope and determine the y-intercept
Subjects:
Grades:
6th - 9th, Adult Education
Types:
CCSS:
Also included in: Scatter Plot Mini-Bundle
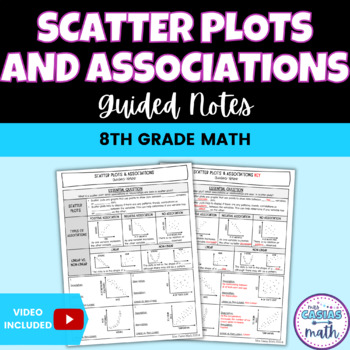
Scatter Plots and Associations Guided Notes Lesson
These notes introduce what scatter plots are as well as key characteristics of scatter plots (positive, negative, and no associations, and linear vs. non-linear). There are four examples where students describe the independent/dependent relationship and identify any associations/trends that they observe. Students and teachers love how easy these notes are to follow and understand. These notes get straight to the point of the skill being taught, which I have found is imperative for the attention
Subjects:
Grades:
7th - 9th
CCSS:
Also included in: Data and Statistics Guided Notes and Worksheets BUNDLE 8th Grade Math
Writing Linear Equations Math Stations | Math Centers
⭐️⭐️⭐️ This set of math stations allow students to practice writing linear equations in a variety of forms. ✅ Stations Included: Writing Linear Equations in Slope Intercept Form Given the SlopeWriting Linear Equations in Slope Intercept Form Given Two PointsWriting Linear Equations in Point Slope FormWriting Linear Equations in Standard FormWriting Equations of Parallel & Perpendicular LinesPredicting with Linear ModelsAnswer keys are included.❤️ A digital version is included as well! Avail
Grades:
7th - 10th
Types:
Also included in: Middle School Math Activities Bundle
Scatter Plots Print and Digital Stations
These stations make great practice or review for scatter plot concepts, including determining correlation, describing relationships in bivariate data, identifying appropriate trend lines, constructing scatter plots, writing an equation for a line of fit, making predictions, and stating the meaning of the x- and y-intercept and the rate of change. Students practice by working collaboratively in groups and moving around the classroom where they find a new set of practice problems at each table. S
Grades:
7th - 9th
Types:
Also included in: 8th Grade Math Curriculum Mega Bundle
8th Grade Statistics Project- Scatter Plots: Analyzing Asthma
I created this project as a fun way for my 8th grade students to apply their knowledge of scatter plots in a meaningful way. They had a lot of fun!Students pretend to be biostatisticians investigating why asthma rates in a city are skyrocketing. Students get to uncover the environmental cause of the increased rates of asthma and investigate how different factors are associated with asthma attacks.Students get lots of practice: - creating scatter plots using a table of data- selecting an appropri
Subjects:
Grades:
8th - 10th
Types:
CCSS:
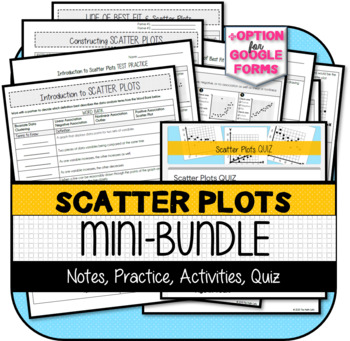
Scatter Plots MINI-BUNDLE
This resource contains the following items:1) Notes with Practice Problems2) Activities (Constructing Scatter Plots & Matching Line of Best Fit)3) Test Practice4) Quiz5) Answer KeysThis resource was developed to meet the requirements of the 8th Grade Statistics & Probability Standards below:CCSS.MATH.CONTENT.8.SP.A.1 Construct and interpret scatter plots for bivariate measurement data to investigate patterns of association between two quantities. Describe patterns such as clustering, out
Subjects:
Grades:
7th - 9th
Types:
Showing 1-24 of 652 results

