146 results
Graphing classroom decor microsofts
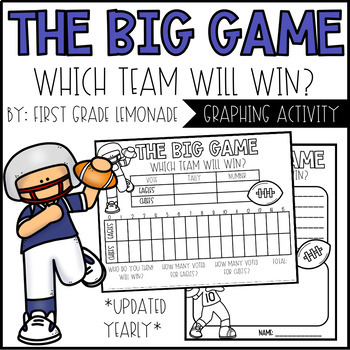
Super Football Game 2024 | UPDATED 2024 BOWL
* this activity will be updated YEARLY. INCLUDED:1. Football l Graph – Students will graph class results on the graph 2. Voting Ballots – Each student will color their football colors of team A or B. Class will discuss which two colors they will be using to represent each team.3. Writing Prompt – Which team will win? **I ALWAYS use my ballot box when doing any sort of voting activities. My students absolutely love it! I take one vote out of the box at a time and record it together with them on
Grades:
K - 5th
Types:
Jr. Zoo Keepers~Supplemental Activities for Young Learners
Either before or after traveling on your Zoo Field Trip this year, complete the activities in this Jr. Zoo Keeper Unit! You and your young learners will just love participating in the hands-on, engaging, and exploratory activities included. There are opportunities to practice math (graphing, surveying), ELA (making words, journal prompts) and social skills (job application.) Topics throughout the unit focus on being a Zoo Keeper, Animals, and the Zoo. At the completion of all the activities,
Subjects:
Grades:
1st - 3rd, Staff
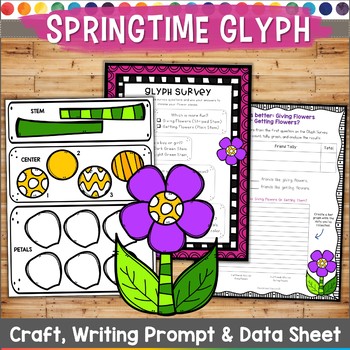
Springtime Flower Glyph
A glyph conveys information in picture form. With this resource, students will express their thoughts about Springtime topics through a craft. The Flower Glyph can be used as part of a Springtime unit, or just as a fun seasonal activity.
Included in this resource are:
-Glyph Survey
-Flower Glyph Template Page
-Flower Pieces
-Data Sheet
-Writing Prompt
-Springtime Stationery
*All pages are included in color and black/ white.
Save money and get the Glyph BUNDLE! You'll get all future updates and
Subjects:
Grades:
K - 3rd
Also included in: Glyph Bundle
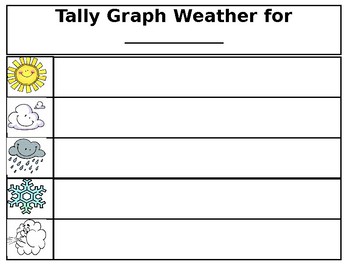
Tally Mark Monthly Weather Graph for Calendar
Tired of using the same weather graph for your calendar time? Look no further! I have included a monthly blank calendar graph using tally marks. You can copy a sheet for each student for their monthly calendar journals. Easy, small and clear for your students to use!
Subjects:
Grades:
PreK - 2nd
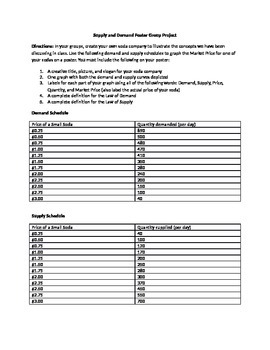
Supply and Demand Poster Group Project
I use this lesson as a summative authentic assessment for the Economic concepts of the Laws of Supply and Demand, Supply and Demand Curves, and Market Price (Equilibrium).
I divide my students into groups of 3-4 and have them create their own unique soda, product slogan, and graph the given supply and demand schedules to find the Market Price for their new soda.
This lesson requires poster paper, markers/colored pencils, and rulers and will take about an hour to complete.
This lesson inclu
Subjects:
Grades:
9th - 12th
Types:
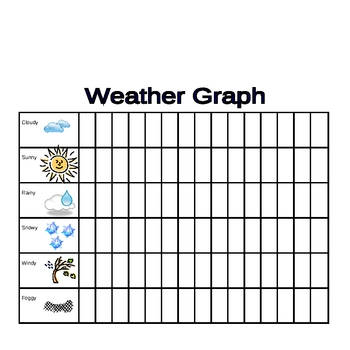
Weather Display / Graph / Pieces / Chart for Calendar w/ Sign Language
I made this weather set for my classroom calendar. I use it with Pre-K, but it is really more appropriate for first and second.
Set includes a display for the weather (I laminated), a chart to graph the monthly weather (I laminated; use wet erase marker to reuse monthly), 10 pieces** (hot, cold, cool, warm, sunny, cloudy, rainy, snowy, foggy, and windy), and a weather sign language chart
**Use Velcro dots to place pieces on and off display
Subjects:
Grades:
PreK - 5th
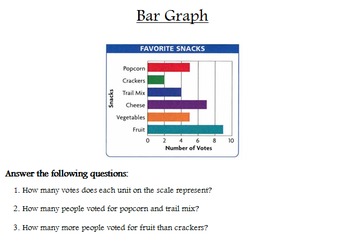
Interpreting Graphs Posters (Line Plot, Bar Graph, Line Graph, Etc)
Students practice interpreting several types of different graphs including line plot, bar graph, line graph, pictograph, double line graph, histogram, circle graph, and stem-and-leaf plot. Poster size sheets, so you can have students rotate in small groups or use in a math center. Answer key is included. I have a free graphic organizer that you can download that will help students learn about the different types of graphs first. Check it out!
Grades:
3rd - 7th
Types:
Matter PowerPoint Lesson- Mega Pack-Pennant Banner-Activities
This Matter Mega Pack (over 70 Pages) is the perfect way to introduce matter to your students! Go through the power point with your students then students can use the writing prompts combined with the pennant banner (in full color) for a matter bulletin board! Such an easy and cute bulletin board. Take a look at the preview for a more comprehensive view of what you will get.
You won't regret this product purchase, guaranteed!
Each Item includes the following:
POWER POINT-38 Slides packed with
Subjects:
Grades:
1st - 4th
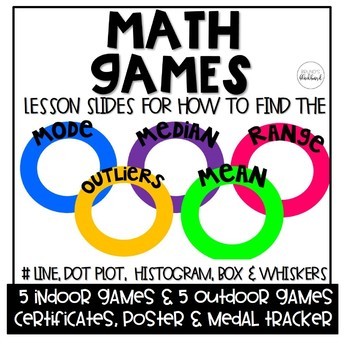
Math Games: Mean, Median, Range, Outliers & Graphs
Math Games
Students will learn how to find the mean, median, mode, range, range playing Olympic style games while practicing and creating Number Lines, Box Plot, Histograms and Box and Whiskers graphs.
This product is a zip file that contains a PowerPoint teaching how to find the mean, median, mode, range, outliers, number plot, dot plot, histogram, box and whiskers, 10 games and an editable create your own game. As well, a PDF file which has posters, awards and placing ribbons. Plus, 2 folda
Subjects:
Grades:
Not Grade Specific
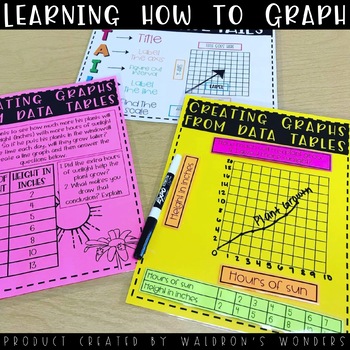
Learning How to Graph
In this product you will find:-How to graph power point to go over the TAILS graphing procedure-Printable 8.5x11 posters for the students to use as a reference to use TAILS-A cut out of TAILS for their interactive notebooks-Creating graphs from word problems and data tables practice (6 different full page printables)-Creating graphs from data tables printables manipulatives (cut and glue/velcro/magnets etc. See product pictures for how I made them with Velcro!-Independent practice (could be a qu
Subjects:
Grades:
4th - 12th
Types:
Math TEKS 5.4C&D recognizing, generating,& graphing numerical patterns vocab
This Power Point Set was developed to expose fifth grade students to vocabulary contained within and connected to Texas fifth grade math TEKS. It contains 2 full 23 slide power points featuring all the vocabulary words listed below.
One slide show includes definitions, pictures, and vocabulary words. The other contains the pictures and words but has the definitions removed for display on word wall compliant with Sheltered Instruction.
The slides are kept intentionally simple with white backgrou
Subjects:
Grades:
5th
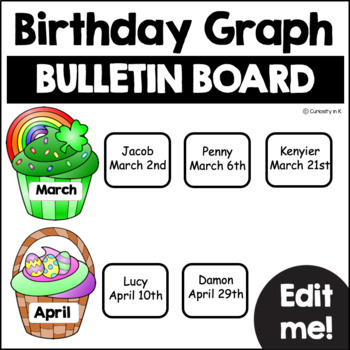
Birthday Display | Birthday Bulletin Board | Bar Graph
Looking for a creative way to display birthdays in your classroom this year? This graph birthday bulletin board display is just what you need! All of your students' birthdays will now serve as a math bar graph! This document comes with two different size colored cupcakes to fit the bulletin board you are using. Simply print, cut, and laminate the cupcakes to use year after year! Then use this editable PowerPoint to add your students' names onto the rectangle or square templates and assemble into
Subjects:
Grades:
PreK - 2nd
Types:
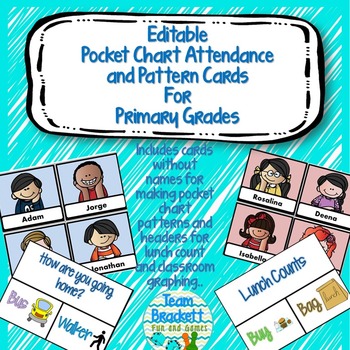
Pocket Chart Attendance and Pattern Cards for Primary Grades - editable
Give your students a sense of responsibility by having them record their attendance and other classroom data. The customizable cards can be used in a pocket chart for gathering data on attendance, lunch count, transportation and a number or other class routines. Blank header cards allow you to create your own data sets.
The cards include multicultural kids with visual clues for even the youngest students. Not only will your students love being able to move their own card to itps appropriate hea
Subjects:
Grades:
PreK - 5th
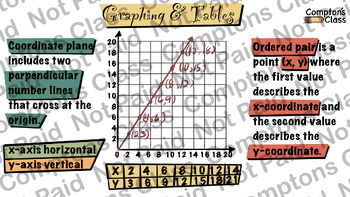
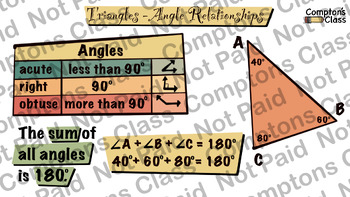
Compton's Class Algebraic Representations 6th Grade Math Package
4 Anchor Charts that deals with Algebraic Representations.
Grades:
6th
CCSS:
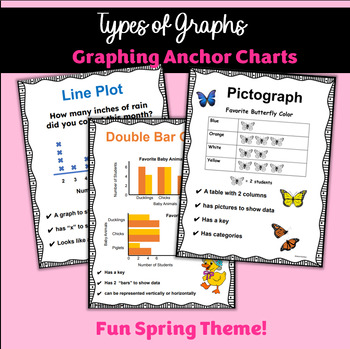
Types of Graphs: Anchor Charts & Graph Visuals for Math Wall Center Printables
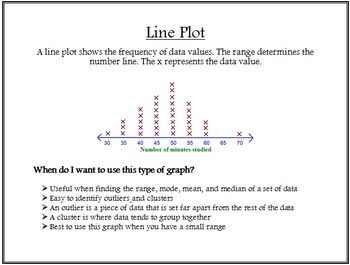
This fun spring theme graph instant download printable resource on different types of graphs includes seven 8.5 x 11 anchor charts with minimal clip arts to focus on the specifics of the graphs. Each page has a title, definitions, and examples of each type of graph with fun spring graphs with a spring theme. Print and post these graph visuals to help students remember or refer back to, the different types of graph. Put them on your math word wall, math vocabulary wall, or at math centers and sta
Types of Graphs Posters
Students will explore a variety of different types of graphs and learn about the characteristics and advantageous traits of each type. These posters include the following types of graphs: bar graph, line graph, pictograph, circle graph, line plot, histogram, stem-and-leaf plot, and double line graph. You can display these posters in your classroom for student reference. You can also download my free product named "Types of Graphs Graphic Organizer" and use the posters to help students explore th
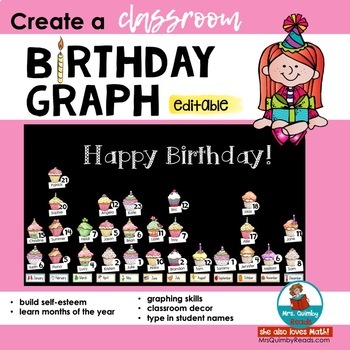
Birthday Graph | Bulletin Board Ideas | Self-Esteem |Graphing Skills | Math
Create a Class Birthday Graph! Build Self-Esteem! Would you like an engaging first week of school activity that brightens your classroom and teaches?Teach graphing skills and classroom community with this great beginning of the year activity and at the same time you and your students will be creating a beautiful classroom environment! Perfect for a first day of school activity. This teaching resource has everything you need to make this beautiful Class Birthday Graph: Colorful CupcakesMonths
Subjects:
Grades:
K - 3rd
CCSS:
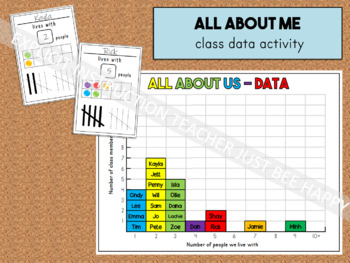
Maths All About Me Whole Class Data Activity Graphing Start of the Year
Fun start of the year Maths activity for Pre-Primary to Year 2 students (Australia)Editable PowerPoint filesMini-sheets are 4 to a page (A4)Class graph sheet is A3Free fonts embedded in files:-Henchgirl comic-The Bold Font-Primer Print
Grades:
PreK - 2nd

A Culminating 2D Shape Project
This is a fun and engaging way to end a unit on 2 Dimensional shapes. Your students will have the opportunity to create something using 2 D shapes, write how many of each shape they used, graph the amount, and then write an informational piece about what they created. Also included in this resource is an exit ticket which allows the students to show what they have learned about the 2 Dimensional shapes (square, circle, rectangle, triangle, and hexagon). The students are asked to identify how

Graphing & Data Analysis Disney 4 Park Challenge
Students will practice graphing multiple sets of data using real time data of Disney park wait times. Student scenario: Your group is doing the 4 parks in one day challenge which means park hopping all 4 Disney Parks in one day! You will need to decide on one ride from each of the 4 parks you’d like to ride most and create a poster graphing the hourly wait times comparing the 4 rides so you can map out your day strategically. Students are also given information about the fast pass prices and wil
Subjects:
Grades:
6th - 10th
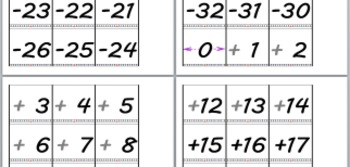
Numberline Positive Negative Integers -32 to +32 number line bulletin board size
FINALLY! A decent number line for teaching positive and negative numbers and beginning addition and subtraction of integers. Really, this is the bomb. I have used it.
Simple but not too simple, big enough to see, enough numbers to help learn to add and subtract, but not enough to take up all the wall space you have. Print and cut into rows of three numbers each.....then just tack them up. All done!
Comes with a sign about how signs interact in operations.
This is a large font posi
Grades:
Not Grade Specific
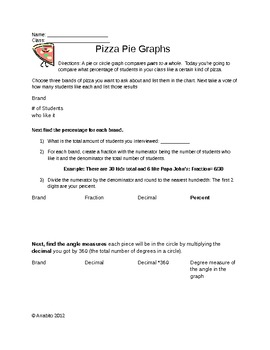
Pizza Pie Graphs Circle Graph Project
An in class project for middle school math with differentiation and rubric provided.
Aligned to 7th grade NYS and Common Core math standards.
Students survey to collect data and represent the data in a circle graph. The pizza theme makes it easy to let the students decorate their graph accordingly; makes a great bulletin board display!
The project is differentiated with two tiers. The less challenging project has fewer categories and more explicit directions and examples. The students will
Subjects:
Grades:
6th - 8th
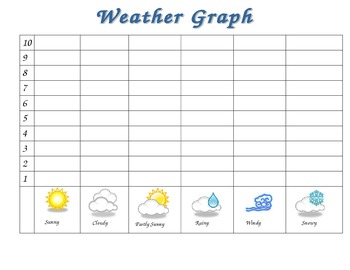
Weather Graph and Tally Chart
Perfect for checking weather in the morning with your class! You can use this as a whole class or individually.
Included are:
1 Weather Graph Recording Sheet
1 Weather Tally Recording Sheet
Subjects:
Grades:
PreK - 2nd
Types:
Showing 1-24 of 146 results


