121 results
Free 1st grade statistics resources
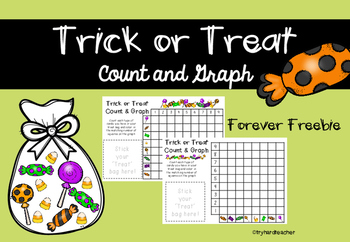
Trick or Treat Count and Graph Halloween Math Fun
Want to add some fun to your Math activities this Halloween? Why not use this FOREVER FREEBIE count and graphing activity to reinforce your graphing, counting and statistics work!
This pack contains-
*6 different 'Treat' bags
*2 different graph layouts
THIS IS A HALLOWEEN THEMED PRODUCT SO PLEASE BE AWARE OF THE RANGE OF RELIGIONS AND CULTURES WITHIN YOUR CLASS
I hope you find this product useful- don't forget to leave feedback so other people get to know about it too! Find a problem? Why no
Subjects:
Grades:
PreK - 2nd
Types:
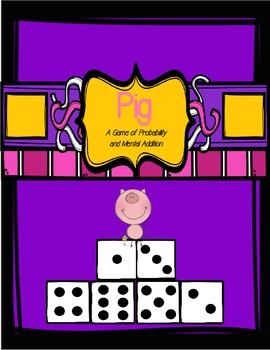
Pig - A Mental Addition and Probability Game
The game of Pig is designed to help students develop and practice their mental addition skills. It can also be used to introduce and explore the concept of probability.
The object of the game is to be the first player to achieve a score of 100 or more.
On a player’s turn, he/she will roll two dice as many times as he/she likes and will mentally keep a running total of the sums that they roll. For example, if a player rolled a 2 and 4 (6) and then 2 and 2 (4), his/her running total would be 1
Subjects:
Grades:
1st - 6th
Types:
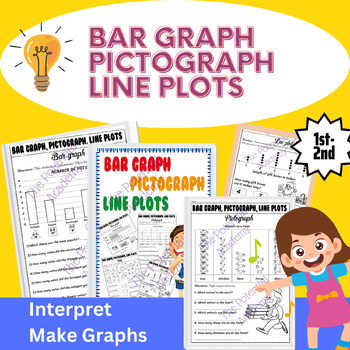
Bar Graphs, Pictographs, Line Plots, Tally Graph worksheet - Types of graph
Are you looking for a mix of no-prep activities for bar graphs, pictographs, and line plots? This Bar Graph, Pictograph, Tally, and Line Plots pack includes a variety of exercises for practicing reading graphs, showing data, and analyzing data on bar graphs, pictographs, and line plots in no time!The two main activities, reading graphs and drawing graphs, were designed with different practices to enhance their understanding of working with bar graphs, pictographs, tally, and line plots. There ar
Subjects:
Grades:
1st - 2nd
Types:
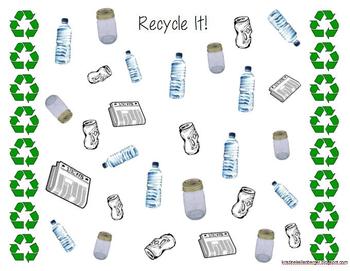
Recycle It! Tally Activity
This is my first worksheet to upload to TPT and I hope you can find it useful!This activity was created to incorporate Earth Day, recycling, and math concepts of tallying and graphing. Use the first page of the various items that we recycle (paper, glass, aluminum, and plastic) as a map to be left at a Math Center. The second page is the students' recording sheet. Students should mark a tally for each item, count the tallies, and then create a graph. There are two versions included, one full col
Subjects:
Grades:
K - 2nd
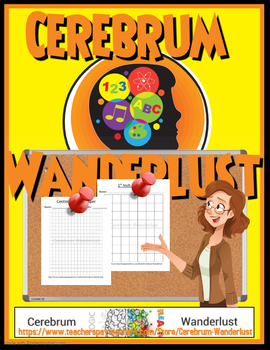
Centimeter & 1 Inch Grid Papers (Full Sheets Each)
A full sheet of Centimeter Grid Paper and a full sheet of 1 inch Grid Paper all contained in one easy to transport/store .pdf. You can use these sheets with making charts, plotting points, etc... Enjoy and thank you for your support.
Subjects:
Grades:
PreK - 12th, Higher Education, Adult Education, Staff
Types:
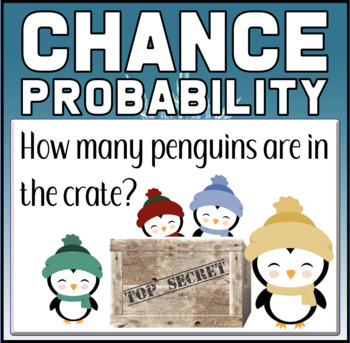
Chance | Probability - Penguins
Chance and Probability are a breeze with these Penguins activities. Your students will be immersed in the language of probability and logical thinking.The following activities/worksheets are included:- A Probability PDF copy that you can use to present to the students.- A Probability Powerpoint version for presenting with animations for revealing the answers.- Copies of the probability puzzles so that individual challenges can be uploaded online.- Chance and Probability Answer Sheet
Subjects:
Grades:
K - 3rd
Types:
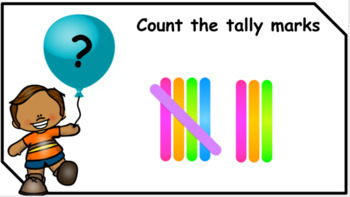
*FREE Sample* No Prep Tally Marks *Google Slides/Distance learning*
This is a free sample of my No Prep Digital Resource of Counting Tally Marks.This is designed for Google Slides *Widescreen 16:9.I want to help all those teachers struggling to find new ideas for their Google Slides. The student types the answer into the text box.I have the full version with 40 slides for sale in my store.
Subjects:
Grades:
K - 3rd
Coin Toss Probability Activity
This is an activity designed to do independently, in pairs, or in a guided group. Lends to discussion and discovery of probability, elementary understanding of mode, and graphic organization of information to compare and contrast. Students will flip a coin a total of ten times per trial and record results by simply shading in the space below the realistic-looking coins. A second opportunity to practice is provided if you would like to do one as guided practice (pennies), and one as independent p
Subjects:
Grades:
K - 2nd
Types:
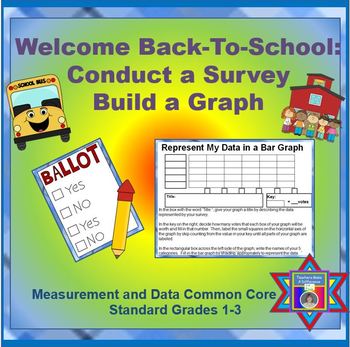
Graphs FREEBIE Back-To-School: Conduct a Survey & Build a Graph (CCSS Aligned)
FREE!!! FREE!!! FREE!!! FREE!!! FREE!!! FREE!!! FREE!!!
PLEASE take time to provide feedback in exchange for the download! I appreciate your time!
I created what I hope to be a fun but helpful resource for your students in Grades 1-3. In return, I ask that you please take time to rate and leave feedback to let others know how the activity worked for you and your students. I appreciate your time and effort!
In Grades 1-3, students are expected to be able to build their own bar
Grades:
1st - 3rd
Types:
Place Value Dice
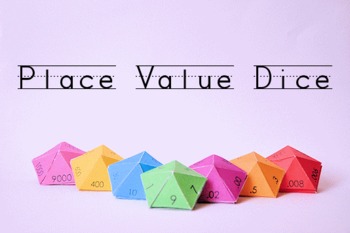
Place Value Printable Dice
Ages 5-14
Practice place value, estimation�even probability�with 10-sided dice.
Supports place value explorations as students toss to add values, practice writing numbers in expanded form and more
Represents ones, tens, hundreds, thousands place and tenths, hundredths thousandths place.
Hand folded dice made for quiet, center-based activities include Activity Guide and measure 3" in diameter each
Grades K-8
Subjects:
Grades:
PreK - 8th
Types:
Chance Probability Match Up Cards
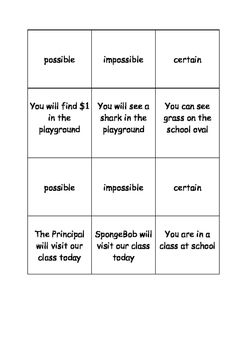
A set of cards with situations and probabilities to be used for a matching activity.
Subjects:
Grades:
K - 3rd
Types:
Count and Graph Minibeasts Tally Chart Block Graph Project and Activity Sheets
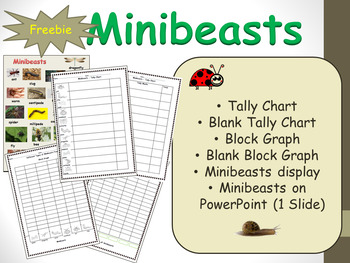
This math and science link freebie relates to minibeasts - bugs and insects topic. There is a display of common minibeasts, a tally chart and block graph for students to complete whenever they see a minibeast.Also included:- blank tally chart and blank block graph - Students have the option of naming and sketching the minibeasts they find.A useful printable freebie - all you need are clipboards and pencils.The minibeasts are also displayed on PowerPoint - discuss with the students the kind of m
Subjects:
Grades:
K - 2nd
Types:
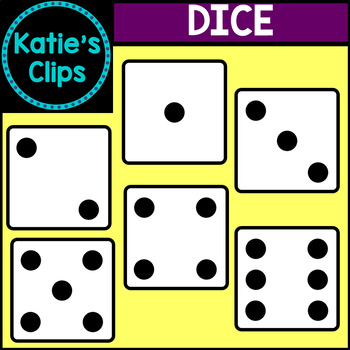
Dice Clipart
Included in this set are 6 dice images.
All images are in png format with transparent backgrounds so you can easily layer them into your projects.
This product is part of my Math Clipart Bundle where you can purchase the entire set of math clipart at a discount!
Subjects:
Grades:
PreK - 5th
Also included in: Math Clipart Bundle
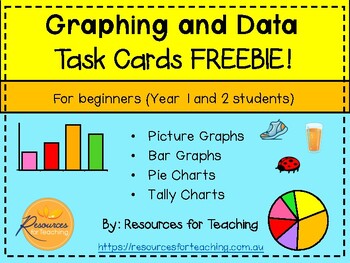
Graphing and Data Task Cards FREEBIE! Year 1 and 2 Students
This FREEBIE includes 16 differentiated task cards for Year 1 and 2 students who are learning how to analyse and interpret data graphs. This is a sample of our '48 Graphing and Data Task Cards' that are great for your whole class! To get the FULL RESOURCE click on the link HERE!This download comes with 3 of each 4 graph styles: picture graphs, bar graphs, pie charts and tally charts. Each graph/ chart comes with a question below which require students to analyse the data and record their answer
Subjects:
Grades:
1st - 3rd
Types:
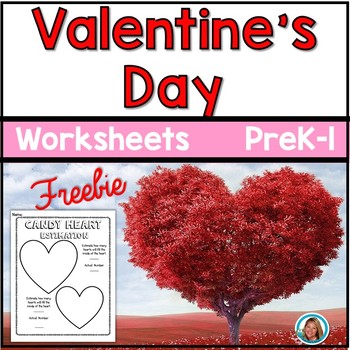
Valentine's Day Activities
Looking for a few great printables to use during Valentine's Day with your students? I have you covered with this free download. Add some candy hearts and create a fun learning environment for your class to enjoy!*********************************************************************************What is in this download?Pg. 1 CoverPg. 2 PoemPg. 3 I SPY Missing NumbersPg. 4 Candy Heart ESTIMATION Pg. 5 MORE ResourcesPg. 6 CreditsYOU CAN FIND THIS and MORE IN MY Valentine's Day CRAFTS and PRINTABLESR
Subjects:
Grades:
PreK - 3rd
Types:
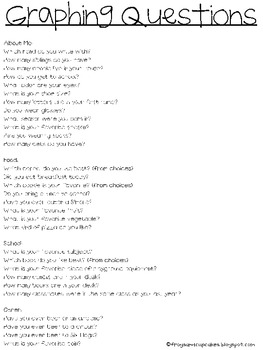
Graphing Questions
A list of questions to use for class surveys. Includes pictures of a DIY graphing mat. Visit this blog post for more details!
Subjects:
Grades:
PreK - 5th
Types:
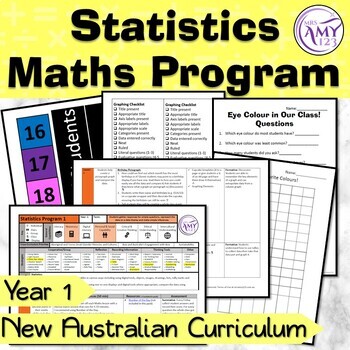
Year 1 Statistics Australian Curriculum Maths Program
Introducing our set of Statistics Maths Programs for year 1 students where they gather responses for simple questions, represent the data on a data display and make simple inferences. This digital downloadable resource aligns with the Australian Curriculum and consists of two engaging modules, spanning across 10 lessons, designed to be taught over the course of a year. Crafted with interactive and cooperative learning strategies, these programs aim to captivate and educate young minds effectivel
Subjects:
Grades:
1st
Types:
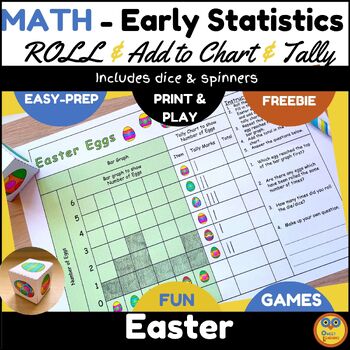
Easter Statistics Math - Bar Chart, Tally & Picture Graph - K to Grade 2 Games
Are you looking for fun Easter statistics activities for Grade 1? Generate data about Easter eggs and use bar graphs, tally charts, and picture graphs (or pictographs) to answer questions including a challenging statistics range one. This set has 3 activities plus a cute dice and spinner and is perfect for exploring early statistics. Easy setup plus clear instructions make these activities ideal for centers too.Your students will generate data using either the spinner or die/ dice with differen
Subjects:
Grades:
PreK - 2nd
Types:
CCSS:
M&M's Frequency Chart
This is an M&M's frequency chart created by Clint Hill to be used in gathering data from M & M activities. This file is a notebook file for use on a SMARTboard. The file can be used alongside actual M & M's or independently of candy. Once M & M data is gathered, it is your choice as to what can be done with it. You could create various graphs representing the data or discuss mean, median, mode, and range (central tendency).
Subjects:
Grades:
K - 4th
Types:
Probability Hands-On Partner Activity
Use this FREE hands-on math activity to help your students explore the concept of probability.
Please rate this product and let me know if you have any questions! Enjoy!
You may also like:
Math Activities BundleArea & Perimeter ActivitiesAddition & Subtraction ActivitiesGeometry ActivitiesPlace Value & Rounding ActivitiesFraction ActivitiesMultiplication & Division ActivitiesMultiplication Models Cut and PasteMultiplication Number Searches
Subjects:
Grades:
1st - 4th
Types:
Survey & Graphing Activity/Assessment
This is an activity where students create and conduct their own survey, organize the results in the form of a bar graph and answer questions regarding the results.I use this as a final assessment for the graphing unit, however, it could definitely be used as a practice worksheet. You could also replace the 2nd page (graphing) with a blank paper if you would like your students to make a different type of graph and still use the first and last page.*Couple explanations- The big box on page 1 with
Subjects:
Grades:
1st - 2nd
Types:
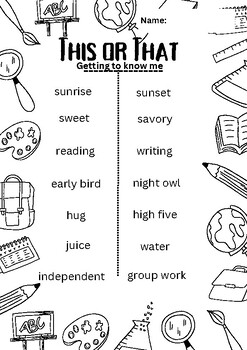
This or That
Get to know your students with this quick task. Provoking conversation and allowing students to nominate their likes and dislikes. Ext- Gather data, collating and discuss the groups preferences. Includes a blank page for students to create and share their own.
Grades:
K - 5th
Types:
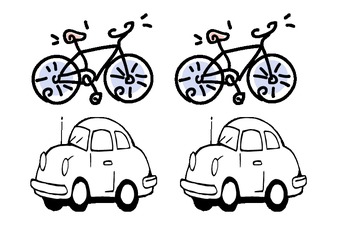
Picture Graph Pics - How the class travels to school
This is just a 4 page resource of pictures I used to introduce picture graphs to my year 1's.
There are four different pics - A bus, a car, a bike and someone walking.
I told the students that we were going to make a picture graph of how our class travels to school. We first made a tally table on the board and then students got the picture that matched their method of transport they take to school and got to colour it in. Once everyone had finished we made a big whole class picture graph.
A
Subjects:
Grades:
K - 2nd
Types:
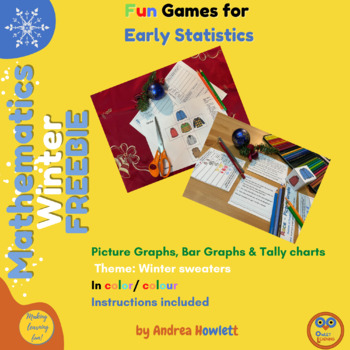
Fun Winter theme Math Game - Statistics
This free Winter game will create lots of fun for math games. Students will be generating data to create a statistics graph e.g. a bar graph, tally chart and/ or picture graph also sometimes known as a pictograph or pictogram. They will use their statistics table to interpret this data, ask and answer questions. Where there is a difference in U.K. and U.S. spellings I have provided both, but they are on different sheets for students so please choose the correct version. This will help your stude
Subjects:
Grades:
K - 3rd
Types:
Also included in: Christmas Statistics & Number Bundle
Showing 1-24 of 121 results


