53 results
High school statistics simulations for GATE
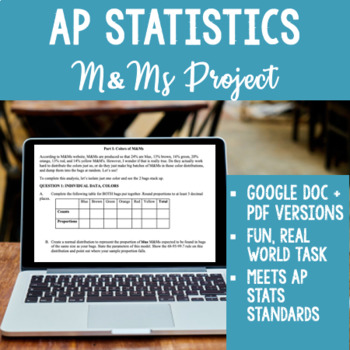
AP Statistics M&M Sampling Distribution Project - Works for Distance Learning!
NEW for 2020! This resource now includes both a PDF for printing out a physical copy AND a fully editable Google Doc link for remote or distance learning! Assign the Google doc to your students, and they can type their answers directly into the document and submit their work digitally. They can also create normal curve diagrams in Google Docs using Insert-Image (kids figure out how to do this quite quickly, as I learned this year!)I use this project every year in my AP Statistics class to demyst
Subjects:
Grades:
10th - 12th
Types:
Also included in: AP Statistics Project Bundle! 6 Projects + digital versions
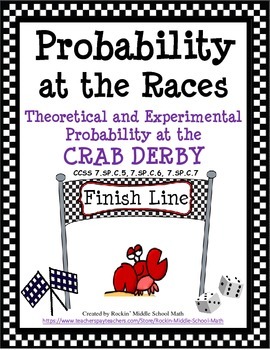
Probability-Theoretical and Experimental-Crab Derby Race CCSS 7.SP.C.5, 6, and 7
This is a fun, engaging 3 part activity including lesson plan that will have your kids so engaged they will forget they are actually learning math. Students will first work in groups/partners and simulate a crab derby race in a game using the sum of two dice to see whose crab will cross the finish line first. Then, they will complete a matrix of possible outcomes when two dice are tossed and added together to get particular sums. They will answer questions that apply to both theoretical and e
Subjects:
Grades:
5th - 9th
Types:
12 Days of Christmas: A Computer Spreadsheet Activity
This great holiday activity shows students how to use a computer spreadsheet to calculate the cost of their true love's gifts in today's dollars.The simple step-by-step procedure will allow both beginning and computer-savvy students to experience success as they learn how to use spreadsheet software. Students will enjoy the engaging and entertaining activity. No computer? No problem! Use the activity master so students can calculate the costs themselves.
Grades:
5th - 9th
Types:

Statistics Survey Project - Project Based Learning (PBL) with Math
Watch your students dive into the world of math as they create, execute, and analyze their own survey! Students will demonstrate mastery of data gathering, survey sampling, developing appropriate survey questions, data tables, Direct Variation, discrete graphs, dot plots, box and whisker graphs, and calculating the inter-quartile range.The Unique Survey Project is highly engaging, capitalizing on the innate curiosity of the adolescent mind. You will love the low-prep instructional guide. Your st
Subjects:
Grades:
6th - 10th
Types:
Also included in: Fun with Ratios Activities Bundle - 7th Grade PBL with Math
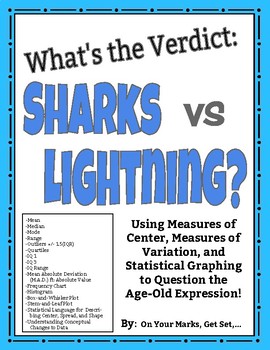
What's the Verdict: Sharks vs. Lightning? Modes of Center, Spread, and More!
Put it to the test! Use the age-old expression: "You are more likely to get struck by lightning than to be bitten by a shark!" to learn and practice Measures of Center, Measures of Spread, Measures of Shape, and Statistical Graphing including:MEANMEDIANMODERANGEOUTLIERS [Using IQR +/- 1.5(IQR)]QUARTILES [lower quartile (IQ-1) and upper quartile (IQ-3)]INTERQUARTILE RANGE (IQR)MEAN ABSOLUTE DEVIATION/ M.A.D. ft. ABSOLUTE VALUESYMMETRY/ASYMMETRY OF DISTRIBUTIONCLUSTERS AND GAPSBELL SHAPED CURVE AN
Subjects:
Grades:
5th - 12th, Higher Education, Adult Education
Types:
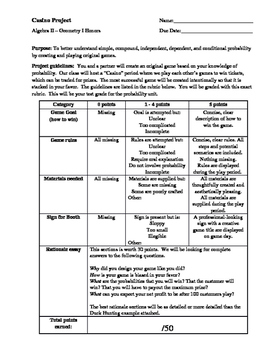
Carnival Probability Project
A project that feels like a game!
Students must create their own game, using probability to ensure THEY are favored to win....much like the house in a casino. Students can make games involving dice, spinners, cards, "fishing" ducks out of a pond, etc.
Assessed skills include: fundamental counting principal, theoretical probability, experimental probability, independent events, dependent events, creativity, writing, presentation. *Students must already know basic probability to complete this
Subjects:
Grades:
8th - 12th
Types:

Normal Distribution in a real life context: Lake Tekapo Fish Mongers
Are you having trouble explaining what Normal distribution is and how it can be used in real life? Are your students craving a hands on activity that would make sense of this concept? Do you need an engaging project on statistics? Would you like an activity that already has enrichment, scaffolding and all of the material ready to go? If you answered yes to any or all of these questions, this project is tailor made for you!Your students will assume a role of a research team for a fishing company.
Subjects:
Grades:
10th - 12th, Higher Education
Types:
CCSS:
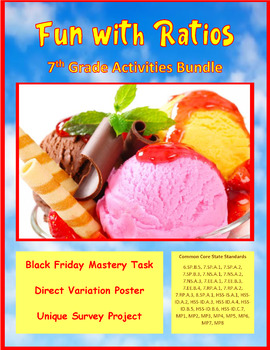
Fun with Ratios Activities Bundle - 7th Grade PBL with Math
The purpose of the Fun with Ratios Activities Bundle is to give students the opportunity to use creativity to apply ratios, proportions, and percentages in real-world settings. This bundle includes three unique tasks: Black Friday Mastery Task, Direct Variation Poster Mastery Task, and the Unique Survey Project. These activities and their accompanying materials are suited for students in grades 7 through 9. These lessons make excellent sub plans. Each project takes approximately two 60-minute bl
Subjects:
Grades:
7th - 9th
Types:
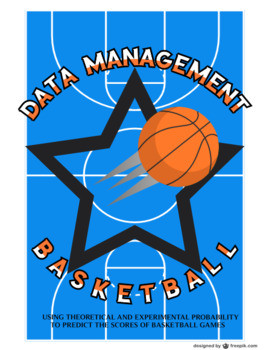
The Ultimate Basketball Learning Activity & Game - Data Management & Probability
DATA MANAGEMENT AND BASKETBALL!Can be used as a performance task for Data Management and Number Sense and Numeration! Want an exciting and fun activity to get students interested in Data Management? This is the resource for you! Combining competitive gameplay, exciting research, and fun this activity is a surefire way to get your class interested in Data Management. You'll create player profiles and using experimental probability determine the outcome of basketball games played between your
Subjects:
Grades:
5th - 12th, Adult Education
Types:
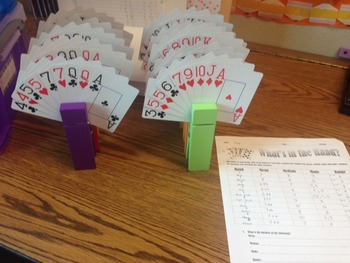
Statistics Mode, Median, Mean, Range Worksheet for Math or Psychology
What's in the Hand: Activity makes learning mode, median, mean, and range fun. You will need two packs of playing cards in order to use 10 different variations. I use giant clothes pins to hold a total of 9 cards for each station. Each student gets a worksheet and is assigned to a group of 4-5 students. Students will complete the first rotation by figuring the mean, median, mode, and range, and then rotate to each other station in about 5 min intervals. At the end they will answer the questions
Subjects:
Grades:
5th - 12th

Casino Probability Project
Have your students demonstrate their understanding of probability by setting up a casino in your classroom with games created by the students. The casino currency can be candy, manipulative counters, or pennies (to be returned at the end of class).
Subjects:
Grades:
7th - 12th
Types:
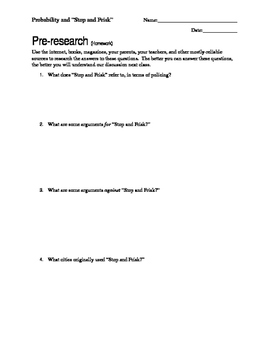
Using Probability to Teach Social Justice
This is an exploratory experiment/activity about basic probability. Students discover the differences between theoretical probability, experimental probability, and reality by taking a hard look at Stop and Frisk in urban areas. Students also deal with independent and dependent events.
By the end of the project, students will be able to:
Articulate the differences between theoretical and experimental probability through prediction and experimentation.
Articulate the differences between indep
Subjects:
Grades:
8th - 12th
Types:
CCSS:
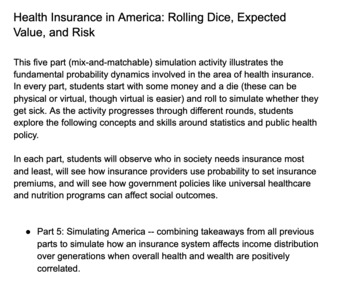
Simulating Health Insurance in America: Full Activity and Teacher Guide
Health Insurance in America: Rolling Dice, Expected Value, and RiskThis five part, mix-and-matchable, large group simulation activity illustrates the fundamental probability dynamics involved in the area of health insurance. In every part, students start with some money and a die (these can be physical or virtual, though virtual is easier) and roll to simulate whether they get sick. As the activity progresses through different rounds, students explore the following concepts and skills around sta
Subjects:
Grades:
9th - 12th
Types:
CCSS:
Probability Independent and Dependent Events Activity Paper Chain
Engage students at centers or in partners with this Probability Independent and Dependent Events Paper Chain Activity. Students solve probability questions involving tables, word problems, and diagrams. One link which leads to the answer on the next link. My students LOVE this activity. This resource includes:- Paper chain links with Probability problems- Answer key- Teacher's guide.A great addition to your middle school math curriculum and for differentiation.Also available in money-saving
Subjects:
Grades:
7th - 9th
Types:
CCSS:
Also included in: 7th Grade Math Activities Paper Chains Bundle
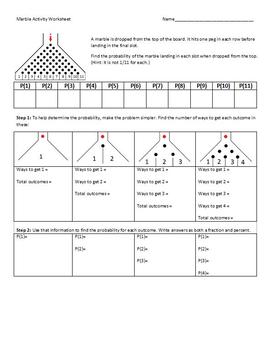
Marble Activity
Fun activity to have students investigate and calculate probability.Using a Plinko-style board, students predict where the marble will drop. Probabilities are then found by breaking the board down into smaller versions and seeing how it relates to Pascal's Triangle to be able to determine the probabilities.There are questions related to the marble drop and probability, some questions about Plinko and an extension using The Wall game show.SMART Notebook presentation, word document and pdf version
Subjects:
Grades:
7th - 12th
Types:
CCSS:
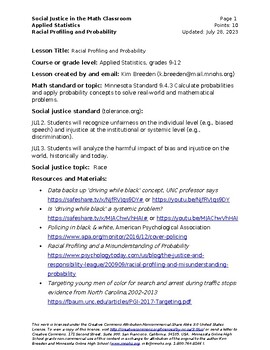
Racial Profiling and Probability (Social Justice Math)
In this assignment, you will investigate racial profiling, or Driving While Black (DWB). African Americans and Latinos/as have complained, filed suit, and organized against what they believe are racist police practices—being stopped, searched, harassed, and arrested because they “fit” a racial profile—they are African American (Black) or Latino/a (Brown). But is this true? How do we know? And can mathematics be a useful tool in helping us answer this question?These questions will be answered usi
Subjects:
Grades:
7th - 12th
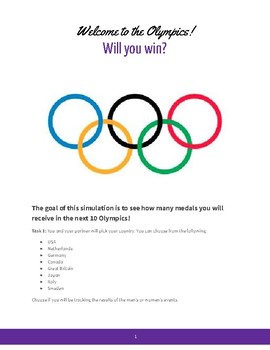
Winter Olympics - Random Number Simulation with Experimental Probability!
This is a collaborative learning activity where students will apply Random Number Simulation to see if their country will receive a medal in the next 10 Olympics!
Students will enhance their technology skills while researching past Olympic wins and losses for certain events. After compiling the existing results, students will run a simulation to gather data about the future Olympics.
Once they have gathered the data, they will find the experimental probability for different outcomes.
This is
Subjects:
Grades:
6th - 9th
Types:
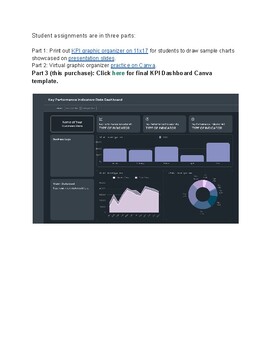
Key Performance Indicators Data Dashboard - Final Project
Student assignments are in three parts:Part 1: Print out KPI graphic organizer on 11x17 for students to draw sample charts showcased on presentation slides.Part 2: Virtual graphic organizer practice on Canva.Part 3 (this purchase): Final KPI Dashboard Canva template.
Subjects:
Grades:
8th - 12th, Higher Education, Adult Education
Types:
Also included in: Key Performance Data Dashboards Bundle
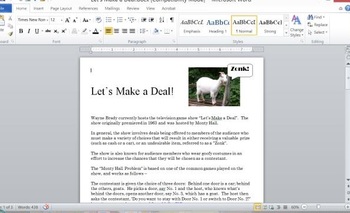
Monty Hall Problem with Fathom Simulation
A guided handout (Word document) and a Fathom Simulation file that introduces students to the famous "Monty Hall Problem" and guides students to the discovery that switching doors is always preferred!
Subjects:
Grades:
7th - 12th
Types:
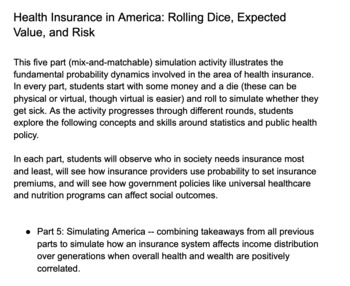
Simulating Health Insurance in America: Probability, Binomials, Expected Value
Health Insurance in America: Rolling Dice, Expected Value, and RiskThis five part, mix-and-matchable, large group simulation activity illustrates the fundamental probability dynamics involved in the area of health insurance. In every part, students start with some money and a die (these can be physical or virtual, though virtual is easier) and roll to simulate whether they get sick. As the activity progresses through different rounds, students explore the following concepts and skills around sta
Subjects:
Grades:
9th - 12th
Types:
CCSS:
Calculator Simulations for Probability and Statistics
If you are obliged to follow a mandated math curriculum at your school, then I suggest you read no further because this site is probably not suitable for you. However, if you are looking for something that is different, yet might spark an interest in either you or your students, then it might be worthwhile for you to continue reading.In 1994 I wrote an alternative curriculum for our Probability and Statistics students that employed Monte Carlo simulations. The students’ reactions were so positi
Subjects:
Grades:
10th - 12th
Types:
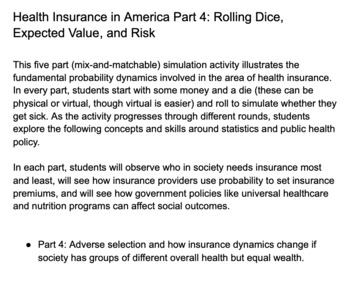
Health Insurance in America Part 4 (Activity and Teacher Guide)
Health Insurance in America Part 4: Rolling Dice, Expected Value, and RiskThis five part (mix-and-matchable) simulation activity illustrates the fundamental probability dynamics involved in the area of health insurance. In every part, students start with some money and a die (these can be physical or virtual, though virtual is easier) and roll to simulate whether they get sick. As the activity progresses through different rounds, students explore the following concepts and skills around statisti
Subjects:
Grades:
9th - 12th
Types:
CCSS:
Also included in: Simulating Health Insurance in America: Full Activity and Teacher Guide
Dice game and app with Scratch (Distance Learning)
In these lessons, you will learn how to create a dice game with Scratch. The game is useful as a random number generator. It is useful when teaching randomness and probability. Students learn coding skills. Students learn to create their own dice face with a free online graphics application. Each lesson comes with detailed step by step instructions.
Grades:
2nd - 12th, Higher Education, Adult Education, Staff
Types:
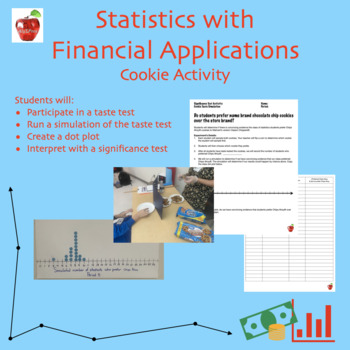
Cookie Simulation Activity - Statistics with Financial Applications
In this activity students will participate in a taste test to gather real data then run a simulation for the same experiment to determine if there is statistically significant evidence that students prefer Chips Ahoy cookies over an off-brand. Students will also answer questions and create a dot plot using the data.
Subjects:
Grades:
9th - 12th, Higher Education, Adult Education
Types:
Showing 1-24 of 53 results


