149 results
Research for Microsoft Excel
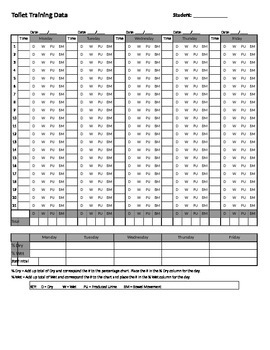
Weekly Toilet Training Data Collection Sheet - Great for ABA
Toilet Training Data Collection Sheet
This Weekly Toilet Training Data Collection Sheet allows a teacher, parent, or other provider to monitor the toileting of a child or student.
The chart monitors if a student is dry, wet, produced urine, and if the student produced a bowel movement.
The chart also monitors the percentage of dry and wet days.
See picture preview for better understanding!
Great for ABA!
Grades:
PreK - 7th

Computer Hardware & Software - Build a Computer | Distance Learning
Teach the basics of computer hardware and software while letting students explore what's inside the computer! This unit helps students explore and understand the basic components inside the computer. This is perfect for any technology class in upper elementary or middle school. All files provided are fully editable, allowing teachers to make modifications for differentiation or personalization if they choose. A Microsoft PowerPoint presentation (fully editable) is included to introduce the topi
Grades:
7th - 9th

Tides and Moon Phase Graph Activity using NOAA
Students will develop a graphical model of the Earth-Sun-Moon system to describe the cyclic patterns of lunar phases and how they affect our tides.
NGSS-MSESS1-1
In this activity, students will go to the NOAA website and collect tidal data from a region around the US. Students plot a month of tidal data and predict the moon phases based on how high the high tides are and how low the low tides are (spring vs neap tides). Students are amazed to find that their predictions are right by looking a
Subjects:
Grades:
6th - 12th, Higher Education
Types:
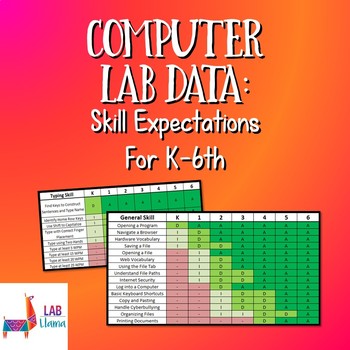
Computer Lab Data: Skill Expectations
As a new computer lab teacher, I found myself asking what ability level should I expect from my students? I was afraid to plan a lesson without knowing if the given grade level would be able to master the skill. Because of this, I compiled several years of data to outline what skills I expect students to be able to complete at a given grade level.This product data consists of the following categories of expectations: General Skills, Typing, Microsoft Office, Microsoft PowerPoint, and Microsoft E
Grades:
K - 6th
Types:
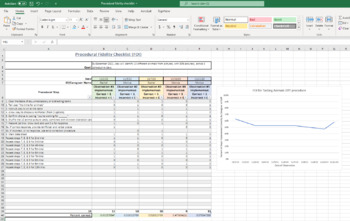
Procedural Fidelity Checklist and Graphing Tool
This is a procedural fidelity or treatment integrity checklist. It is in an Excel format because it is already formatted to graph the data you enter. You can copy the tabs within the workbook or into a new workbook to keep the formulas and formatting.
Grades:
Not Grade Specific
POSHA–S Database
IPATHA Series: POSHA–S Database The Public Opinion Survey of Human Attributes–Stuttering or POSHA–S Database, intermittently updated, contains about 25,000 respondents from 45 countries and 30 languages or dialects, representing 11 world regions. The file includes supplementary databases of two experimental versions of the instrument used from about 2000 through 2008, the POSHA–E1 and POSHA–E2, which were administered to 744 and 1103 respondents, respectively, in 6 additional countries and 1 add
Grades:
6th - 12th, Higher Education, Adult Education
Types:

Cross-Curricular Road Trip Project
This Road Trip Project is a great cross-curricular project to try out in any classroom grades 6-12! It brings together Social Studies, Mathematics, Language Arts, and Science all in one!
Students will research and use Google Docs and Excel to completely plan out an educational road trip across the country!
Students will create a day-to-day itinerary with weather predictions, a map visual showing their journey, a letter to their principal explaining the educational value of the trip to requ
Grades:
6th - 12th
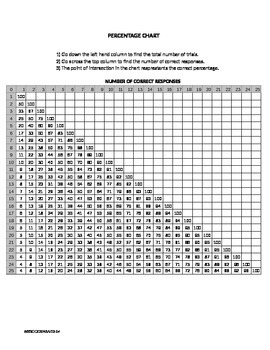
Percentage Chart ABA Monitor Number Of Trials, Correct Responses, and Percentage
Percentage Chart to Monitor Trials On Targeted Behavior Or Academic
This Percentage Chart allows a parent, teacher, or other service provider to monitor number of trials, number correct responses, and percentage correct on a targeted behavior or academic.
See Preview for chart!
Great for ABA!
Grades:
PreK - 7th

My Favorite Cookies A Microsoft Excel Project
I found that my students really enjoyed doing this project. Students will use Excel and its capabilities, to create and do advanced formatting on charts, tables, and images.
This project is an application of project based learning. The project is divided into 8 steps that are clearly illustrated.
This project is ideal for teachers to give their students the entire project or give just one step at a time for those classes that don’t meet regularly.
Students will get practice in:
• Using
Grades:
6th - 10th
Also included in: Microsoft EXCEL Activities - 6 PROJECTS!
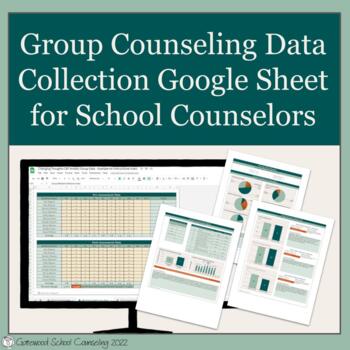
Group Counseling Data Collection Spreadsheet for School Counselors
Use this Google Sheet to collect data on any group! All you have to do is put in your group’s raw data and the form will automatically calculate averages, percent change, and generate graphs in a striking data report. With minimal time you can create professional reports for your stakeholders to advocate for your school counseling program. You don’t need to know how to do anything fancy in spreadsheets - I’ve already done all the coding for you!Download includes:Spreadsheet to collect participat
Grades:
Not Grade Specific
Also included in: School Counseling Data Collection Spreadsheets
POSHA–Cl Database
IPATHA Series: POSHA–Cl Database The Public Opinion Survey of Human Attributes–Cluttering or POSHA–Cl Database, intermittently updated, contains about 3000 respondents from 125 countries and 10 languages. Among public and nonpublic samples, more than 40 self-identified clutterers and 40 stutterers are included. The Microsoft Excel file features more than 160 columns and up to 3500 rows. Some data, such as places of birth and residence, primary job or occupation, languages known, race, and religi
Grades:
6th - 12th, Higher Education, Adult Education, Staff
Types:

Alternating Treatment Design (ATD) Graphing Template
Streamline your data collection and analysis process with this comprehensive Alternating Treatment Design (ATD) graphing template in Microsoft Excel. Perfect for behavior analysts, educators, and researchers, this user-friendly template allows for easy input of data and automatic generation of clear and visually appealing graphs to track intervention effectiveness.
Grades:
Not Grade Specific
Types:
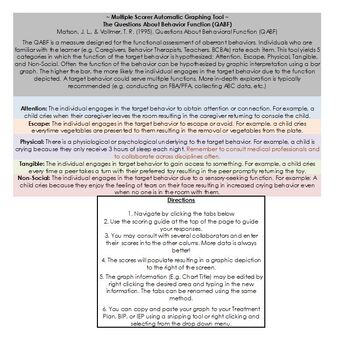
QABF Automatic Graphing Tool (multiple raters)
Editable Automatic Graphing tool for QABF. Multiple Scorers The QABF is a measure designed for the functional assessment of aberrant behaviors. Individuals who are familiar with the learner (e.g. Caregivers, Behavior Therapists, Teachers, BCBAs) rate each item. This tool yields 5 categories in which the function of the target behavior is hypothesized: Attention, Escape, Physical, Tangible, and Non-Social. Often the function of the behavior can be hypothesized by graphic interpretation using a
Grades:
Staff
Types:
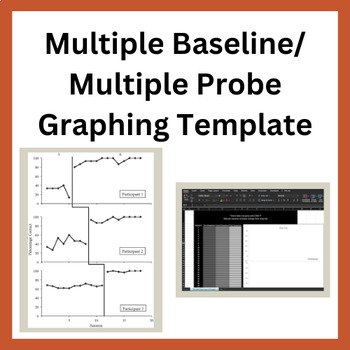
Multiple Baseline/Multiple Probe Excel Template
Data is your best friend as a special educator. With this graphing template, you will be able to graph your data in a staggered manner in order to protect from any kind of threats to internal validity. You will be able to tell if your teaching/intervention is successful across students, behaviors, and/or environments.
Subjects:
Grades:
Not Grade Specific
Types:
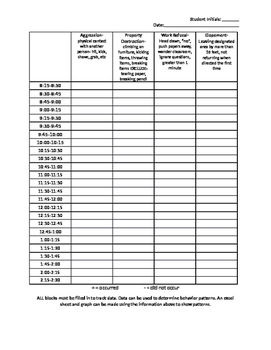
Behavior Tracking Data Sheet ABA
This is an editable 15 minute data tracking sheet which can easily be filled out and tracked. The data can be placed into an excel spreadsheet and graphed as well. Data sheets like these are used by Applied Behavior Analysis specialists. As a teacher, filling out the sheet is quick and easy.
Subjects:
Grades:
Not Grade Specific
Types:
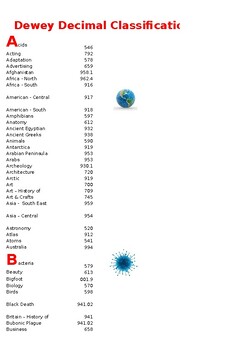
DEWEY DECIMAL CLASSIFICATION POSTER
Dewey Decimal Classification PosterThis resource is an excel document, therefore, all aspects of the document can be changed to suit your needs.The document can be printed on A4 paper then photocopied onto A3 paper, laminated and displayed in the library.
Subjects:
Grades:
Not Grade Specific

Psychology Research - Survey Writing, Data Collection, Correlation Graphing
I teach Dual Enrollment Psychology 101. There's no better way to understand Psychology Research Methods than to conduct your own research. This project requires students to come up with a research question, guided survey questions, collect data, chart and graph that data, recognize correlation, then reflect on their results.While this project is designed to be used in Psychology, I supply you with DOCX files so that you can change the directions to suit ANY SUBJECT! For example, I was require
Grades:
9th - 12th, Higher Education
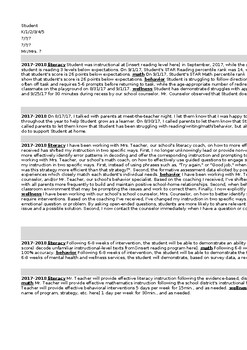
Multi-Tiered System of Supports (MTSS) Template
MTSS (Multi-Tiered System of Supports) can be a confusing process. Many times, we’re already doing things to help our students. However, unless it’s in “MTSS” language, it doesn’t count! I’ve been working with teacher teams the past few years to look at what we’re already doing to support our students in Tier I, II & III, and how we can put these effective interventions in MTSS language. The result has been more recognition of what teachers are already doing, increased interest in new resear
Grades:
PreK - 8th, Staff
Types:
Weather Tracking in Excel
Compatible with Google Sheets, Google Classroom, or as a stand-alone file on a PC, this product is a must have for any teacher comparing weather conditions in multiple locations!
BEFORE YOU BUY: This file is part of a larger unit. Save yourself money by purchasing the Super Science Set for Weather and Climate nstead of buying each file separately.
Purchased alone, you get:
⭐ An Excel workbook that enables students to track the weather for 5 different locations as a whole class or individ
Subjects:
Grades:
4th - 8th
Types:
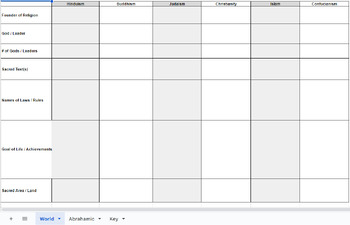
World Religion Comparison Chart
World Religion Comparison ChartFounder, God, # of Gods, Sacred of Text, Rules/Laws, Goal of Life, & Sacred SitesReligions: Islam, Christianity, Judaism, Hinduism, Confucianism, & BuddhismAnswer Key Included
Subjects:
Grades:
7th - 10th
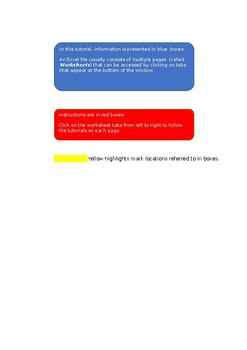
Excel Workbook
This is the excel file that is a 3-part bundle that comprises a video tutorial, an informative handout, and an Excel file meticulously guiding students through a step-by-step process. The aim is to empower students with the skills to transform raw data into concise summative data tables and graphs, complete with standard deviation error bars. The tutorial covers the entire spectrum – from utilizing Excel for table and graph preparation to conducting statistical analyses using Anova tests, t-test
Subjects:
Grades:
9th - 12th
Types:
Also included in: Bundle - Help with Science Fair Table, Graphs, Statistics using Excel.
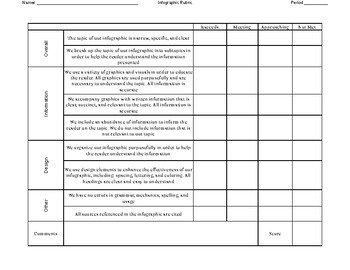
Infographic Rubric
Use this rubric to grade any infographic. Rubric includes the following categories:Topic of our infographicUse of subtopicsUse of variety of graphics/visualsUse of written informationAbundance of informationOrganizationUse of design elementsGrammar errorsSources citedEach of the nine elements are graded as exceeding, meeting, approaching, or not met.
Subjects:
Grades:
6th - 8th
Types:
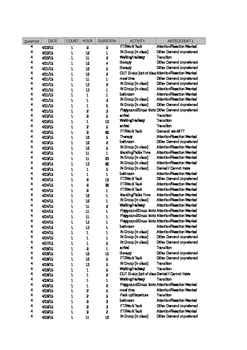
ABA Data Sheet with Frequency, Duration, Intensity computations.
ABA Data Sheet with Frequency, Duration, Intensity computations.
Keep track of your students behavior.
Monitor FERBS, Frequency, Duration, and Intensity.
Let Excel compute the data for you!!!!!!!!
SIMPLE 1 page spead sheet.
Grades:
PreK - 11th
Create a Realistic Financial Plan - Stage 3 & 4 investigation task - HPGe GATS
Financial literacy is important on so many levels, and it should start in primary school.This guided research task requires students to create the beginnings of a realistic budget through the use of digital technology.The Slides file has all the instructions students will need to progress through this task, including links and an explanation of the simple formulas needed to create the budget. The Sheets file is set up for students to begin recording their information easily.Students investigate,
Subjects:
Grades:
5th - 8th
Showing 1-24 of 149 results

