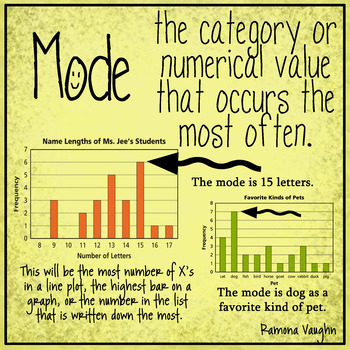
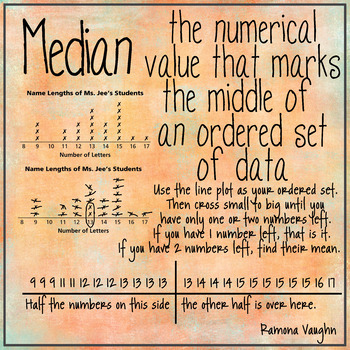
15 results
Statistics poster images
Creating a Box Plot Steps
This product can be used as a resource for guided practice, notes, and/or as a scaffold. I love having my students glue it into their resource notebook so that they have it readily available to look back at whenever they want!Through an example, this graphic organizer includes steps on how to enter a list of data into the TI-84 Graphing calculator to find the 5 number summary. Then, it shows students how to interpret the 5 values and use them to draw a box plot on a number line.
Subjects:
Grades:
7th - 12th
CCSS:
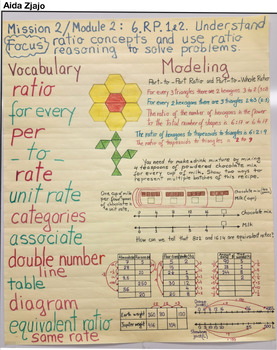
6th Grade Anchor Chart 6.RP.1.2 (Ratios)
6.RP.1-2I made these anchor charts to summarize the Modules' ideas. You will have vocabulary and modeling problem-solving with different strategies from Eureka Module 2 or ZEAR Mission 2. (CCSS)The charts can be used by teachers during intervention time. Other grade levels are good to look into for ideas on what to teach in a small group intervention or just to see which strategies students needed to master in previous grades.
Subjects:
Grades:
6th - 7th
Scatter Plots Anchor Chart
Includes several examples of vocabulary for scatter plots (cluster, positive correlation, line of best fit, etc.)
Subjects:
Grades:
8th - 9th
Types:
CCSS:
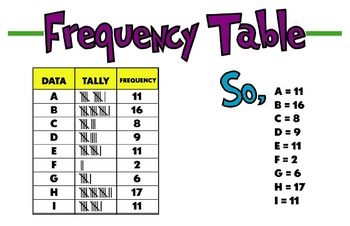
Frequency Table Poster
This poster can serve as a great anchor chart for students learning about Frequency Tables. It is formatted to print out at 11x17 but you can reduce it down for students to paste into a journal.
Subjects:
Grades:
3rd - 8th
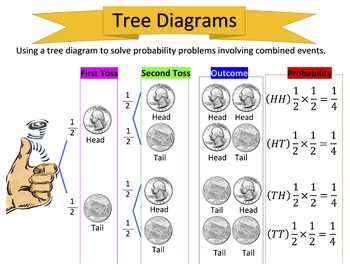
Probability & Tree Diagrams
Students will learn how to use a tree diagram to solve probability problems involving combined events.
Subjects:
Grades:
6th - 8th
![Preview of STEM Poster, Manga Style, Math Expected Value (Digital format [JPEG], 12"x18")](https://ecdn.teacherspayteachers.com/thumbitem/STEM-Poster-Manga-Style-Math-Expected-Value-Digital-format-JPEG-12-x18--10922409-1705759177/original-10922409-1.jpg)
STEM Poster, Manga Style, Math Expected Value (Digital format [JPEG], 12"x18")
These are a set of colorful posters (12 total) which feature kids (teens) who are engaging in a hobby/interest of theirs and also includes a relevant mathematical or scientific equation (e.g. Construction and the Pythagoreon Theorem).This is to show that math/science is in everyday life even if in the background.This one is "Lucky". His hobby is gaming and his equation is the Expected Value equation used in probability and statistics.The best way to print these images is to go to your local prin
Subjects:
Grades:
Not Grade Specific
Types:
![Preview of STEM Poster, Manga Style, Math Regression (Digital format [JPEG], 12"x18")](https://ecdn.teacherspayteachers.com/thumbitem/STEM-Poster-Manga-Style-Math-Regression-Digital-format-JPEG-12-x18--10922483-1705759898/original-10922483-1.jpg)
STEM Poster, Manga Style, Math Regression (Digital format [JPEG], 12"x18")
These are a set of colorful posters (12 total) which feature kids (teens) who are engaging in a hobby/interest of theirs and also includes a relevant mathematical or scientific equation (e.g. Construction and the Pythagoreon Theorem).This is to show that math/science is in everyday life even if in the background.This one is "Florence". Her hobby is chemistry and her equation is the Regression equation.The best way to print these images is to go to your local print shop, and have them print on 12
Subjects:
Grades:
Not Grade Specific
Types:
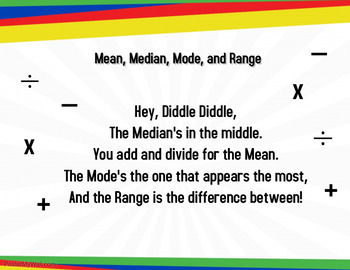
Mean, Median, Mode, and Range Rhyme Poster
This poem will help your students remember the difference between the mean, median, mode, and range, which are often difficult to remember. The fun poster format is easy to print and hang in your classroom!
Subjects:
Grades:
5th - 7th
Types:
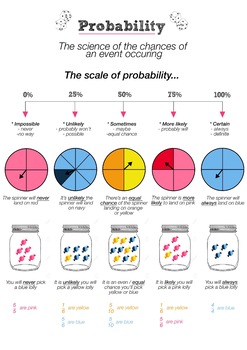
Probability Poster for year five and six CREATED IN A1 SIZE
This anchor poster created in A1 size is essential to teaching probability to year five and six. This resource aligns with the curriculum of statistic and probability and is designed to scaffold learning.
Subjects:
Grades:
4th - 6th
Types:
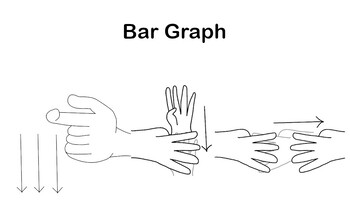
ASL Vocab - Bar Graph
ASL sign for Bar Graph. BAR + GRAPHBAR: Dominant modified C, palm facing out, draws 3 bars in the air side by side.GRAPH: Both 4 handshapes. Non-dominant hand palm faces toward your body. Dominant hand palm starts facing away from body. The 4 handshape moves down behind the non-dominant hand. Then the hand twists so dominant palm is facing the body as well and fingers are pointed to ward non-dominant. Lastly, pull dominant hand sideways away from non-dominant hand. Your fingers should be tracing
Subjects:
Grades:
Not Grade Specific
Types:
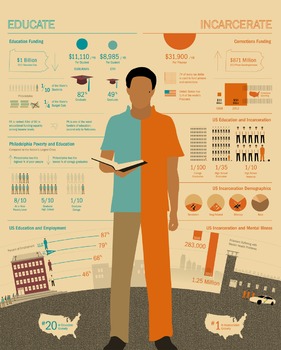
Educate v. Incarcerate
This is a nice flow chart that demonstrated the different between education and incarceration.
Subjects:
Grades:
7th - 12th, Higher Education
Types:
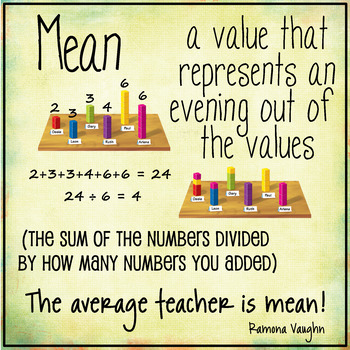
6th grade math MEAN
This is a poster illustrating the meaning of mean.
Subjects:
Grades:
5th - 6th
Types:
Showing 1-15 of 15 results


